. 2022 Feb 5;11(3):441.
doi: 10.3390/plants11030441.

Effects of Light Spectral Quality on Photosynthetic Activity, Biomass Production, and Carbon Isotope Fractionation in Lettuce, Lactuca sativa L., Plants

Affiliations

Effects of Light Spectral Quality on Photosynthetic Activity, Biomass Production, and Carbon Isotope Fractionation in Lettuce, Lactuca sativa L., Plants

Ivan G Tarakanov et al. Plants (Basel). .

Abstract

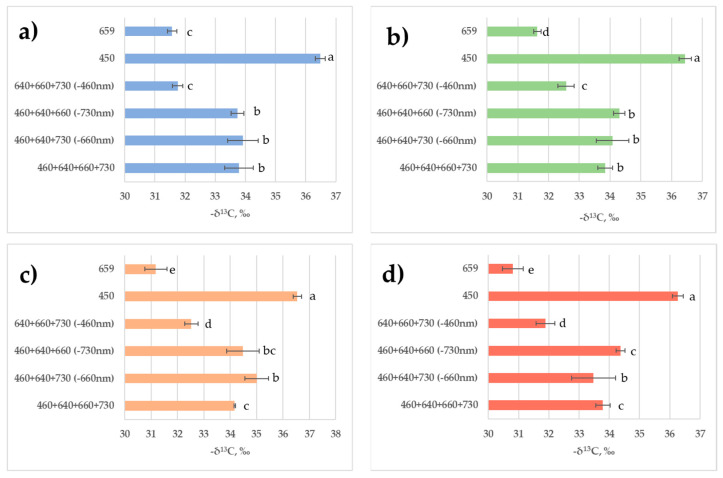
The optimization of plant-specific LED lighting protocols for indoor plant growing systems needs both basic and applied research. Experiments with lettuce, Lactuca sativa L., plants using artificial lighting based on narrow-band LEDs were carried out in a controlled environment. We investigated plant responses to the exclusion of certain spectral ranges of light in the region of photosynthetically active radiation (PAR); in comparison, the responses to quasimonochromatic radiation in the red and blue regions were studied separately. The data on plant phenotyping, photosynthetic activity determination, and PAM fluorometry, indicating plant functional activity and stress responses to anomalous light environments, are presented. The study on carbon isotopic composition of photoassimilates in the diel cycle made it possible to characterize the balance of carboxylation and photorespiration processes in the leaves, using a previously developed oscillatory model of photosynthesis. Thus, the share of plant photorespiration (related to plant biomass enrichment with 13C) increased in response to red-light action, while blue light accelerated carboxylation (related to 12C enrichment). Blue light also reduced water use efficiency. These data are supported by the observations from the light environments missing distinct PAR spectrum regions. The fact that light of different wavelengths affects the isotopic composition of total carbon allowed us to elucidate the nature of its action on the organization of plant metabolism.

Keywords: LEDs; Lactuca sativa; carbon isotope discrimination; chlorophyll fluorescence; photosynthesis; plant factory.


Conflict of interest statement

The authors declare no conflict of interest. The funders had no role in the design of the study; in the collection, analyses, or interpretation of data; in the writing of the manuscript; or in the decision to publish the results.

Figures

Figure 1
Figure 1
Plant-growing chambers with various light environments.
Figure 2
Figure 2
Light treatments: (1) “460 + 640 + 660 + 730”—4-peak reference treatment; (2) “460 + 640 + 730”—3-peak treatment missing red-light R660 region; (3) “460 + 640 + 660”—3-peak treatment missing far-red-light FR730 region; (4) “640 + 660 + 730”—3-peak treatment missing blue-light B460 region; (5) “450”—monochromatic blue-light B450 region; (6) “659” monochromatic red-light R659 region.
Figure 3
Figure 3
Representative photo of plants from each light treatment, 20 days after emergence: (1) “460 + 640 + 660 + 730”—4-peak reference treatment; (2) “460 + 640 + 730”—3-peak treatment missing red-light R660 region; (3) “460 + 640 + 660”—3-peak treatment missing far-red-light FR730 region; (4) “640 + 660 + 730”—3-peak treatment missing blue-light B460 region; (6) “450”—monochromatic blue-light B450 region; (7) “659” monochromatic red-light R659 region.
Figure 4
Figure 4
Growth parameters of lettuce plants in response to various light treatments. Sampling 30 days after emergence. Means ± standard error (SE); means followed by the same letter were not different at p ≤ 0.05. (a) Total leaf fresh weight; (b) total leaf dry weight; (c) length of the biggest leaf; (d) total leaf number per plant; (e) total leaf area; (f) specific leaf weight; (g) stem length. Light treatments from the bottom of y-axis: “460 + 640 + 660 + 730”—4-peak reference treatment; “460 + 640 + 730”—3-peak treatment missing red-light R660 region; “460 + 640 + 660”—3-peak treatment missing far-red-light FR730 region; “640 + 660 + 730”—3-peak treatment missing blue-light B460 region; “450”—monochromatic blue-light B450 region; “659” monochromatic red-light R659 region.
Figure 4
Figure 4
Growth parameters of lettuce plants in response to various light treatments. Sampling 30 days after emergence. Means ± standard error (SE); means followed by the same letter were not different at p ≤ 0.05. (a) Total leaf fresh weight; (b) total leaf dry weight; (c) length of the biggest leaf; (d) total leaf number per plant; (e) total leaf area; (f) specific leaf weight; (g) stem length. Light treatments from the bottom of y-axis: “460 + 640 + 660 + 730”—4-peak reference treatment; “460 + 640 + 730”—3-peak treatment missing red-light R660 region; “460 + 640 + 660”—3-peak treatment missing far-red-light FR730 region; “640 + 660 + 730”—3-peak treatment missing blue-light B460 region; “450”—monochromatic blue-light B450 region; “659” monochromatic red-light R659 region.
Figure 5
Figure 5
CO2—H2O leaf exchange in lettuce plants in response to various light treatments. (a) Net photosynthesis; (b) stomatal conductance; (c) transpiration rate. Means ± standard error (SE); means followed by the same letter were not different at p ≤ 0.05. For light treatments legend see Figure 4.
Figure 6
Figure 6
Light response curves in lettuce plants in response to various light treatments Means ± standard error (SE). For light treatments legend see Figure 4.
Figure 7
Figure 7
(a) Maximum quantum efficiency (Fv/Fm) of photosystem II (PSII); (b) photochemical electron transport rate (ETR); (c) relative PSII operating efficiency (ΦPSII); (d) chlorophyll a non-photosynthetic quenching (NPQ) in the leaves of lettuce plants in response to various light treatments. Means ± standard error (SE); means followed by the same letter were not different at p ≤ 0.05. For light treatments legend see Figure 4.
Figure 8
Figure 8
Carbon isotope composition of the leaves in lettuce plants grown in various light environments during 24 h cycle. Carbon isotope composition is given in PDBV δ13C units. Means ± standard error (SE); means followed by the same letter were not different at p ≤ 0.05. (a) After 6 h of illumination; (b) after 12 h of illumination; (c) after 18 h of illumination; (d) at the end of night after 6 h of darkness. For light treatments legend see Figure 4.

References

    1. Bian Z., Jiang N., Grundy S., Lu C. Uncovering LED light effects on plant growth: New angles and perspectives-LED light for improving plant growth, nutrition and energy-use efficiency. Acta Hortic. 2017;1227:491–498. doi: 10.17660/ActaHortic.2018.1227.62. - DOI
    1. Loconsole D., Cocetta G., Santoro P., Ferrante A. Optimization of LED Lighting and Quality Evaluation of Romaine Lettuce Grown in an Indoor Cultivation System. Sustainability. 2019;11:841. doi: 10.3390/su11030841. - DOI
    1. Chen X.L., Yang Q.C., Song W.P., Wang L.C., Guo W.Z., Xue X.Z. Growth and nutritional properties of lettuce affected by different alternating intervals of red and blue LED irradiation. Sci. Hortic. 2017;223:44–52. doi: 10.1016/j.scienta.2017.04.037. - DOI
    1. Lee M.J., Son K.H., Oh M.M. Increase in biomass and bioactive compounds in lettuce under various ratios of red to far-red LED light supplemented with blue LED light. Hortic. Environ. Biotechnol. 2016;57:139–147. doi: 10.1007/s13580-016-0133-6. - DOI
    1. Fankhauser C., Chory J. Light control of plant development. Annu. Rev. Cell Dev. Biol. 1997;13:203–229. doi: 10.1146/annurev.cellbio.13.1.203. - DOI - PubMed

LinkOut - more resources