

Magnetoelastic Sensor Optimization for Improving Mass Monitoring
- PMID: 35161572
- PMCID: PMC8839310
- DOI: 10.3390/s22030827
Magnetoelastic Sensor Optimization for Improving Mass Monitoring
Abstract
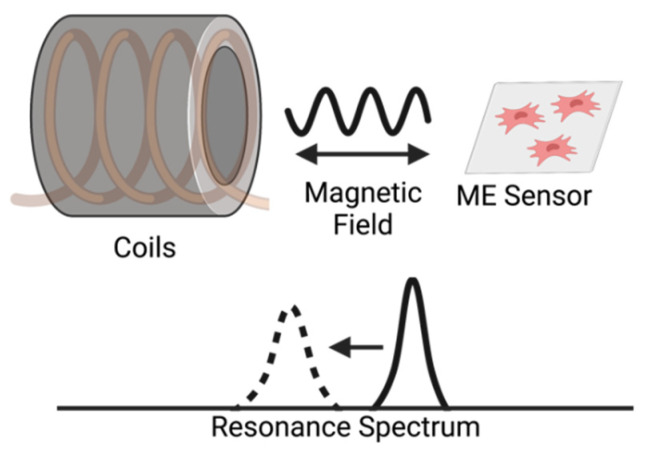
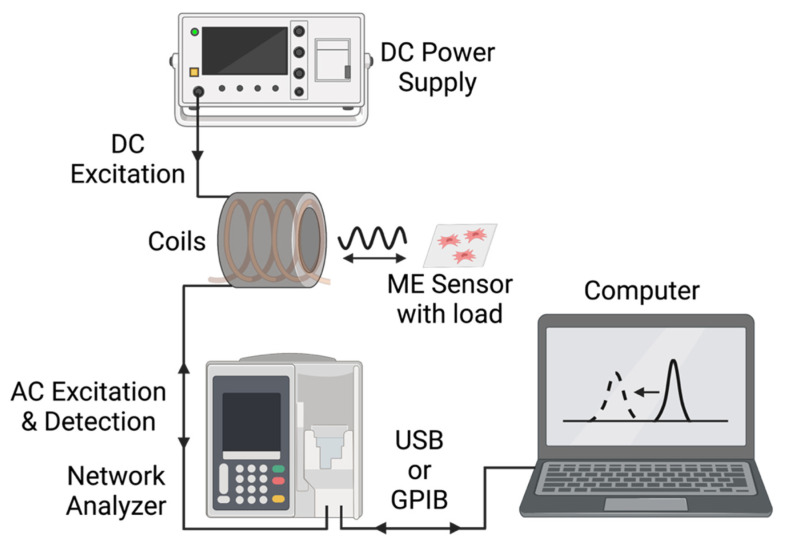
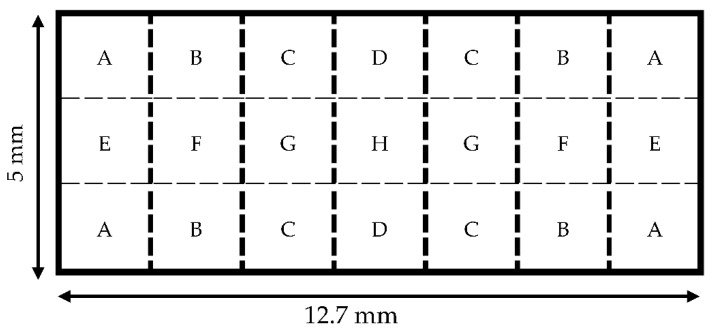
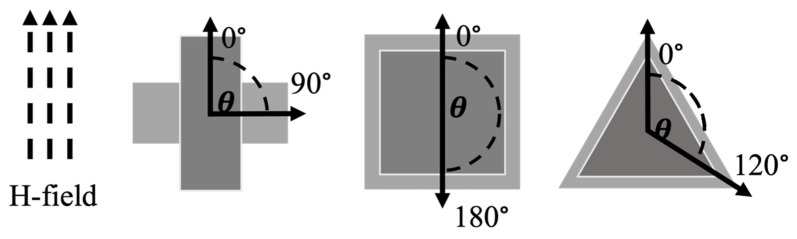
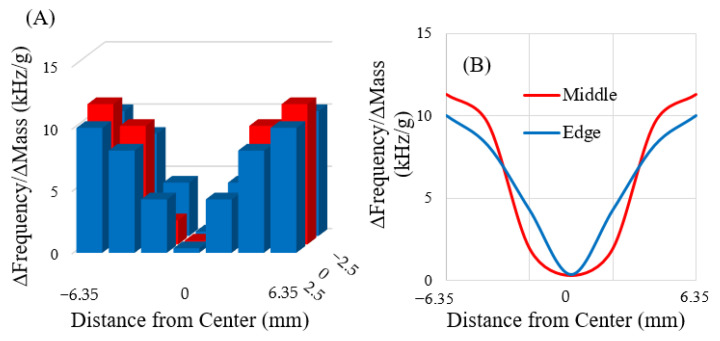
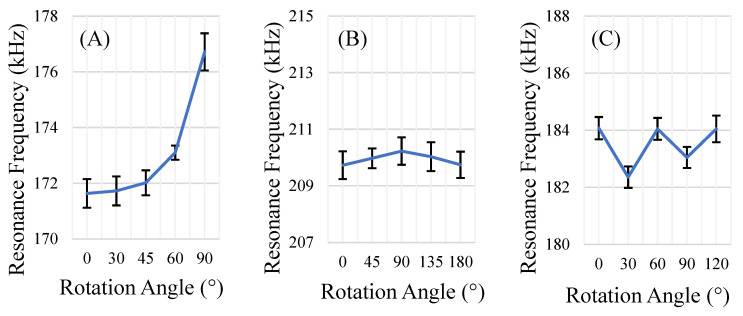
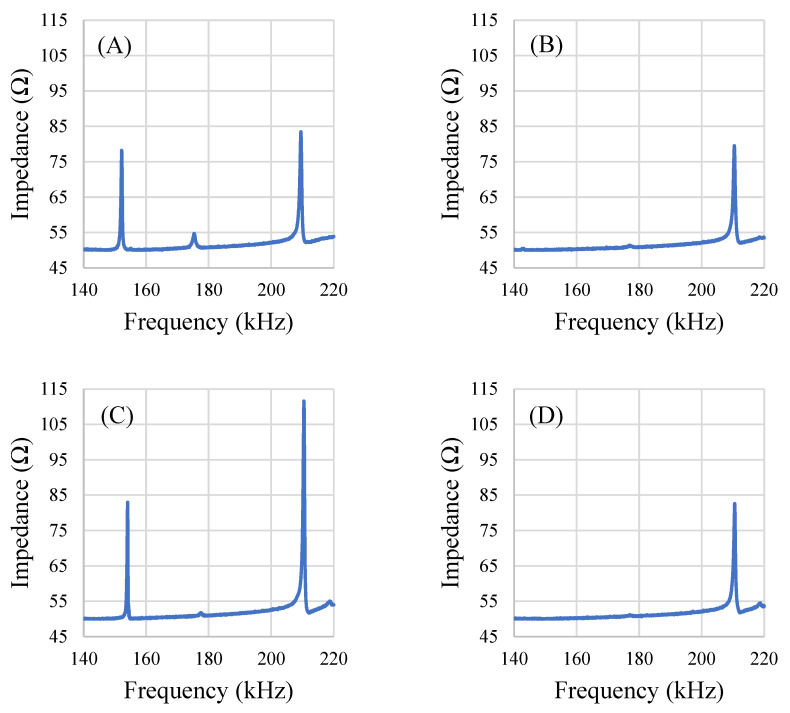
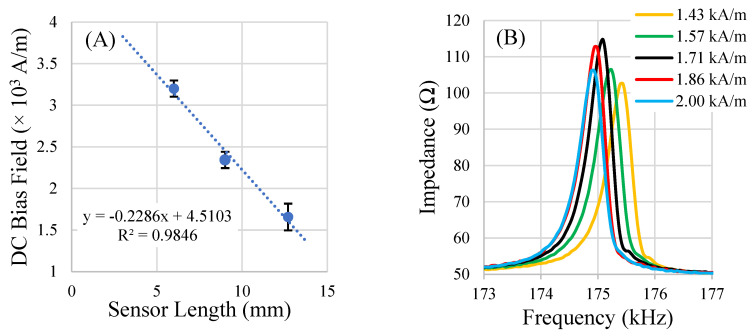
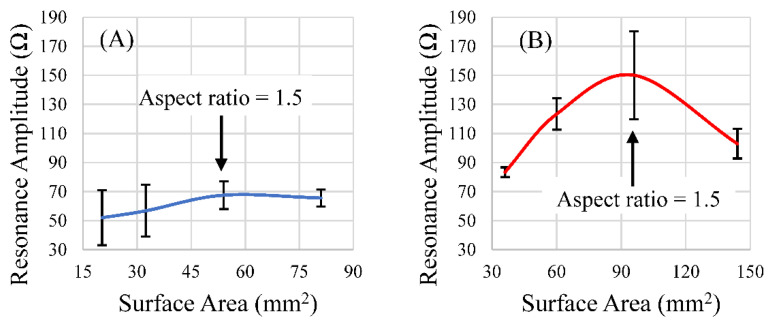
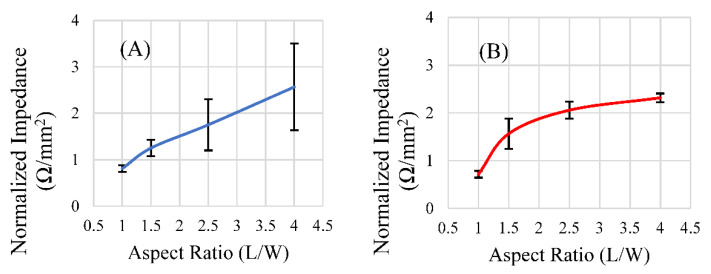
Magnetoelastic sensors, typically made of magnetostrictive and magnetically-soft materials, can be fabricated from commercially available materials into a variety of shapes and sizes for their intended applications. Since these sensors are wirelessly interrogated via magnetic fields, they are good candidates for use in both research and industry, where detection of environmental parameters in closed and controlled systems is necessary. Common applications for these sensors include the investigation of physical, chemical, and biological parameters based on changes in mass loading at the sensor surface which affect the sensor's behavior at resonance. To improve the performance of these sensors, optimization of sensor geometry, size, and detection conditions are critical to increasing their mass sensitivity and detectible range. This work focuses on investigating how the geometry of the sensor influences its resonance spectrum, including the sensor's shape, size, and aspect ratio. In addition to these factors, heterogeneity in resonance magnitude was mapped for the sensor surface and the effect of the magnetic bias field strength on the resonance spectrum was investigated. Analysis of the results indicates that the shape of the sensor has a strong influence on the emergent resonant modes. Reducing the size of the sensor decreased the sensor's magnitude of resonance. The aspect ratio of the sensor, along with the bias field strength, was also observed to affect the magnitude of the signal; over or under biasing and aspect ratio extremes were observed to decrease the magnitude of resonance, indicating that these parameters can be optimized for a given shape and size of magnetoelastic sensor.
Keywords: geometry; magnetoelastic; magnetostrictive; mass; monitoring; resonance; sensor; wireless.
Conflict of interest statement
The authors declare no conflict of interest.
Figures
Similar articles
-
Magnetoelastic Monitoring System for Tracking Growth of Human Mesenchymal Stromal Cells.Sensors (Basel). 2023 Feb 7;23(4):1832. doi: 10.3390/s23041832. Sensors (Basel). 2023. PMID: 36850431 Free PMC article.
-
Wireless, magnetic-based sensors for biomedical applications.Annu Int Conf IEEE Eng Med Biol Soc. 2009;2009:5436-9. doi: 10.1109/IEMBS.2009.5332475. Annu Int Conf IEEE Eng Med Biol Soc. 2009. PMID: 19963643
-
A magnetoelastic resonance biosensor immobilized with polyclonal antibody for the detection of Salmonella typhimurium.Biosens Bioelectron. 2007 Feb 15;22(7):1474-9. doi: 10.1016/j.bios.2006.06.037. Epub 2006 Aug 22. Biosens Bioelectron. 2007. PMID: 16930986
-
Magnetoelastic Resonance Sensors: Principles, Applications, and Perspectives.ACS Sens. 2022 May 27;7(5):1248-1268. doi: 10.1021/acssensors.2c00032. Epub 2022 Apr 22. ACS Sens. 2022. PMID: 35452212 Review.
-
Theory, instrumentation and applications of magnetoelastic resonance sensors: a review.Sensors (Basel). 2011;11(3):2809-44. doi: 10.3390/s110302809. Epub 2011 Mar 2. Sensors (Basel). 2011. PMID: 22163768 Free PMC article. Review.
Cited by
-
An Amplitude Analysis-Based Magnetoelastic Biosensing Method for Quantifying Blood Coagulation.Biosensors (Basel). 2025 Mar 29;15(4):219. doi: 10.3390/bios15040219. Biosensors (Basel). 2025. PMID: 40277533 Free PMC article.
-
Millimeter-scale magnetic implants paired with a fully integrated wearable device for wireless biophysical and biochemical sensing.Sci Adv. 2024 Mar 22;10(12):eadm9314. doi: 10.1126/sciadv.adm9314. Epub 2024 Mar 20. Sci Adv. 2024. PMID: 38507494 Free PMC article.
-
Magnetoelastic Monitoring System for Tracking Growth of Human Mesenchymal Stromal Cells.Sensors (Basel). 2023 Feb 7;23(4):1832. doi: 10.3390/s23041832. Sensors (Basel). 2023. PMID: 36850431 Free PMC article.
-
Biological Impact of γ-Fe2O3 Magnetic Nanoparticles Obtained by Laser Target Evaporation: Focus on Magnetic Biosensor Applications.Biosensors (Basel). 2022 Aug 11;12(8):627. doi: 10.3390/bios12080627. Biosensors (Basel). 2022. PMID: 36005023 Free PMC article.
References
-
- Pacella N., DeRouin A., Pereles B., Ong K.G. Geometrical modification of magnetoelastic sensors to enhance sensitivity. Smart Mater. Struct. 2015;24:025018. doi: 10.1088/0964-1726/24/2/025018. - DOI
-
- Grimes C., Mungle C., Zeng K., Jain M., Dreschel W., Paulose M., Ong K. Wireless Magnetoelastic Resonance Sensors: A Critical Review. Sensors. 2002;2:294–313. doi: 10.3390/s20700294. - DOI
-
- García-Arribas A., Gutiérrez J., Kurlyandskaya G., Barandiarán J., Svalov A., Fernández E., Lasheras A., De Cos D., Bravo-Imaz I. Sensor Applications of Soft Magnetic Materials Based on Magneto-Impedance, Magneto-Elastic Resonance and Magneto-Electricity. Sensors. 2014;14:7602–7624. doi: 10.3390/s140507602. - DOI - PMC - PubMed
MeSH terms
Grants and funding
LinkOut - more resources
Full Text Sources
