Review
. 2022 Jan 27;22(3):999.
doi: 10.3390/s22030999.

Linear Combination Properties of the Phasor Space in Fluorescence Imaging

Affiliations
Review

Linear Combination Properties of the Phasor Space in Fluorescence Imaging

Belén Torrado et al. Sensors (Basel). .

Abstract

The phasor approach to fluorescence lifetime imaging, and more recently hyperspectral fluorescence imaging, has increased the use of these techniques, and improved the ease and intuitiveness of the data analysis. The fit-free nature of the phasor plots increases the speed of the analysis and reduces the dimensionality, optimization of data handling and storage. The reciprocity principle between the real and imaginary space-where the phasor and the pixel that the phasor originated from are linked and can be converted from one another-has helped the expansion of this method. The phasor coordinates calculated from a pixel, where multiple fluorescent species are present, depends on the phasor positions of those components. The relative positions are governed by the linear combination properties of the phasor space. According to this principle, the phasor position of a pixel with multiple components lies inside the polygon whose vertices are occupied by the phasor positions of these individual components and the distance between the image phasor to any of the vertices is inversely proportional to the fractional intensity contribution of that component to the total fluorescence from that image pixel. The higher the fractional intensity contribution of a vertex, the closer is the resultant phasor. The linear additivity in the phasor space can be exploited to obtain the fractional intensity contribution from multiple species and quantify their contribution. This review details the various mathematical models that can be used to obtain two/three/four components from phasor space with known phasor signatures and then how to obtain both the fractional intensities and phasor positions without any prior knowledge of either, assuming they are mono-exponential in nature. We note that other than for blind components, there are no restrictions on the type of the decay or their phasor positions for linear combinations to be valid-and they are applicable to complicated fluorescence lifetime decays from components with intensity decays described by multi-exponentials.

Keywords: FLIM; fractional intensity; hyperspectral imaging; linear combination of phasor; model-free; multidimensional phasor plot; multiple component analysis; phasor; spectral phasor.


Conflict of interest statement

The authors do not have any conflict of interest.

Figures

Figure 1
Figure 1
Phasor transformation. (a) Fluorescence lifetime imaging microscopy (FLIM) measures the fluorescence lifetime decays in different parts of the image (b), and color-codes areas (c) according to their decay times (b) or their phasor clusters (d). The resulting phasor plot (d) represents species that have longer fluorescence lifetimes by larger phase angles. Mono-exponential lifetimes (that is, fluorescence decays that can be fitted with a single exponential and are indicative of a single species) appear on the dark-blue semicircle (known as the ‘universal’ semicircle), whereas multi-exponential lifetimes/sum of exponential lifetimes (where the fluorescence decays require fitting with multiple exponentials, indicative of multiple fluorescent species) appear inside the semicircle. (Panels ad adapted with permission from [27]). (ei) Lifetime phasor transformation. (e) The intensity image. Lifetime data collected (at each pixel, shown with a red square) are transformed to a point in the phasor plot. Phasor points in h can be generated from Fourier transformation of lifetime decays obtained using time-correlated single-photon counting (TCSPC; f) or from frequency domain fluorescence lifetime imaging (g) using the phase shift (ϕ) (change in the x-axis) and loss of modulation (decrease in the y-axis, m) of the fluorescence signal (red) compared with the excitation signal (dark blue). In TCSPC, the decay is calculated by measuring the delay of the fluorescence signal (red) relative to the laser pulse (grey). (i) The phasor plot can be used to color-code the original image. (e,jl) Spectral phasor transformation. The transformation is analogous to the lifetime but using spectral data. (Panels (e,hl) adapted from [30]).
Figure 2
Figure 2
Multicomponent analysis in phasor plot. (ac) Two-component analysis using phasor approach. (a) The intensity decays were calculated using the lifetime of free NADH (0.4 ns, violet) and protein-bound NADH (3.4 ns, red). Different fractions of free to bound NADH were used for calculating the decays in the middle. In increasing percentage of bound NADH—5% (blue), 10% (green), 25% (yellow-green), and 50% (orange). (b) The corresponding phasor positions were calculated, and they appear along the metabolic trajectory [18], connecting the positions of free (violet) and bound (red) NADH. Two-component analysis allows the distribution along the line joining the phasor positions of the individual components to be calculated, as exemplified by free and protein-bound NADH here. However, this is valid for any two original phasor components. (df) Three-component analysis using phasor approach. (d) The lines joining the individual cursor positions (red, blue and green), forming the vertices of the triangle and the phasor point whose fractional intensity contributions are being calculated (black), are extended to the opposite side of the triangle. The distances of the vertices from the black point are used for the calculation of fractional intensity contribution (the graphs). (e) Calculation of three components where two components are related, e.g., free and protein-bound NADH. In this case, the presence of the third component shifts the distribution towards that third component and away from metabolic trajectory. This distance can be converted to the fractional intensity of free NADH and plotted (the graph between green and blue points) or fractional intensity of third species (the graph along the line joining the red vertex and the opposite line). (f) Graphical analysis of three components. A cursor of a given size is scanned along point A and another point in line BC to calculate the fraction of the third component along the axis and then this process is combined for different points on BC to create the fraction of the third component. The number of points along each of these black lines are counted by scanning (orange cursors) and plotted along the coordinates of BC to calculate the fraction of free NADH. (Panels df adapted with permission from [32]). (g) Four-component analysis using phasor approach. Representation of four species with different phasors indicated by the number 1 to 4 (1, red; 2, green; 3, blue; 4, orange). In this case, the individual species are single exponentials since they are on the universal semicircle. The position of a phasor point in a single harmonic inside this quadrangle can be defined by multiple triangles. Multiple harmonics are needed to obtain unique solution for the contribution of the four components. (Panel g adapted with permission from [35]).
Figure 3
Figure 3
Blind component analysis for resolving unknown lifetimes in phasor plot—assuming the components have mono-exponential lifetimes. (a,b) Graphically finding two unknown lifetime components and their relative fractional intensities. (a) Universal circle is scanned for candidate components. For each position of the first component (small blue dot), a line is drawn through the data point (blue empty circle) and the second point is found where the blue line meets the universal circle (large blue filled circle). The second harmonic (h2) for the candidate components are obtained mathematically: small green dot and the large green filled circle. A line is drawn through them (green line). (b) Solution is the only lifetime pair that has the lines (blue and green) going through the data points for the two harmonics, that is, when the distance from the green line to the green empty circle is zero. The relative fractions are obtained by the ratios between the distances from the filled dots to the empty circles on both sides of the line. (c,d) Finding the three lifetime components in the universal circle. (c) Schematic configuration of three components generating a data point (ring in the middle). As an example, the ratio between the two distances is related to the intensity fraction (f) of the component located in the short lifetime region; f1 = d1/(d1 + d1). In the same manner, the other two fractions can be obtained for the other two components. (d) Solution to the three-component problem is the only combination of components such that the three fractions are the same in each of the triangles composed of the three harmonics (blue–green–orange). The short, medium, and long lifetime components in each harmonic are depicted by increasingly larger filled circles. (e) Minimization-based approach. This general algorithm can technically be solved the problem to N number of components depending on noise propagation in the multiple harmonics. (Panels ae adapted with permission from [38]).
Figure 4
Figure 4
Multicomponent analysis based on non-Euclidean geometry. (ac) Simulation to validate the proposed non-Euclidean separation algorithm. (a) Phasor plot of simulated endogenous fluorescence reference sample, (b) exogenous fluorescence reference sample, (c) fluorophores with concentrations varying in opposite sigmoidal fashion. (df) Three-component analysis of drug distribution using non-Euclidean geometry. Simulated endogenous fluorescence contribution to the test image. Estimation of endogenous fluorescence contribution computed using the traditional Euclidean method and using the proposed non-Euclidean method. (Panels af adapted with permission from [37]). (gk) Distance-based method of assigning phasor plot pixel colors in a multicomponent fluorescence contribution analysis algorithm. (g) A sample setup of a distance calculation. Yellow, cyan, and magenta points → the center of exogenous (autofluorescence), and two endogenous reference clusters (TAZ and MNC), respectively, and blue point → a phasor point from the tissue sample. (h,i) Simulated ground truth tissue map of drug distribution and calculated phasor plot. (j,k) Reconstructed tissue drug distribution using the multicomponent phasor analysis algorithm and phasor plot. (Panels gk adapted with permission from [36]).
Figure 5
Figure 5
Improper transformation of fluorescence lifetime decays to phasor plots and their effects. (a) BH 830 card acquisition of the decay of a solution of Rhodamine 110 excited with a high rep laser at 80 MHz with two different settings of the card. (b) Gain of four gives a TAC time range of 12.5 ns. Due to the non-linearity of the TAC at early and later times, only one portion of the decay, indicated by the red and blue lines, is valid giving a total range of about 9 ns, which is insufficient to cover an entire period of the laser. (c) Setting the gain at two gives a total larger range (25 ns) but only one-part corresponding to 12.5 ns is used (indicated by the red and blue lines) which covers an entire period of the excitation laser. The orange shaded parts of the decay are not used. (c) Effect of a decay offset on the ℒN [W] in the simple case where the gate width W is equal to the gate step θ. The calculations were made with T = 12.5 ns, N = 10 (i.e., θ = 1.25). The standard ℒ∞ (semicircle) is represented as a black dotted-dashed curve. ℒN (plain red curve) and ℒN [θ] (plain dark blue curve) are identical, yielding a red/dark blue dashed circular arc. As the decay offset t0 increases (with t0 < θ), ℒN [W] progressively rotates towards and is deformed into ℒN [θ], which is a circular arc (red dashed curve). (d) Continuous phasor of truncated decays. T = 12.5 ns and the calculated loci of continuous phasors of ungated PSED (SEPL) are a function of the observation duration D ≤ T when f = 1/T (d) or f = 1/D (e). In the latter case, all curves are identical to ℒ∞. However, if the phasor frequency is chosen to be the fundamental Fourier frequency f = 1/T, the SEPL increasingly departs from the ℒ∞ as the observation duration D decreases. Please see Figures 7 and 8 from the original [39] for more details and explanation of the mathematical quantities. (Panels a,b and ce are adapted with permission from [40] and [39], respectively).
Figure 6
Figure 6
Reciprocity principle and multidimensional phasor approach. (ad) Reciprocity principle. Phasor signatures from different parts of the image (a) can be segregated (b). Selection of these different phasor clouds (red, blue and yellow circle, (b) allow the image points they originated from to be selected and the image to be colored accordingly (c). Similarly, parts of the image can be selected (blue, yellow and red cursors, (a) and the corresponding phasor points can be highlighted (d). (eh) Multidimensional phasor approach. When the exact same area of a sample is imaged (e) in different moieties using phasor approach, phasor FLIM (f) and spectral phasor (g), then the phasor image (h) can be color-coded according to one selection, in this case, lifetime phasor (f). Using the reciprocity principle, the spectral signatures of those lifetime phasor selections can be identified (g).
Figure 7
Figure 7
Biological examples of fractional intensity contributions of two species based on linear combination of phasor-FLIM. Two-component analysis (known lifetimes of the components) using a graphical approach for metabolic imaging using free to bound NADH. (ac) Nuclear NADH metabolism is dependent on the activity of Sirt1. (a) Intensity and lifetime (FLIM) images for WT and Sirt−/− MEFs. Two representative images per condition are shown. (b) Phasor plot shows the color scale used to visualize the fraction of free/bound NADH along the metabolic trajectory in FLIM images. (c) Histograms show comparative analyses by overlapping the fractional free NADH distributions from WT (cyan) and Sirt−/− (red) MEFs. Free NADH fraction is represented in the x axis, where 1 = 100% free NADH. (Panels adapted with permission from [17]).
Figure 8
Figure 8
Three-component analysis (known lifetimes of the components) using a graphical approach for understanding of effect of diet on mice liver. (ad) Quantification of the presence of oxidized lipids in mice fed with Western diet vs. low-fat diet using three-component analysis. (a) Color-coded phasor-FLIM liver images of mice fed with low-fat diet (LF) or Western diet (WD). The free-to-protein-bound ratio (not including LLS) is color-coded using a magenta to cyan colormap with a yellow overlay for LLS. The corresponding phasor plots are shown for each condition. (b) Blue, red and yellow circles on the phasor plot represent the phasor positions of free and protein-bound NADH, and long lifetime species (LLS), respectively. Histograms showing the percentage of free NADH (c) or LLS species (d) for the LF (black) and WD (red) diet, respectively. (Panels adapted with permission from [32]).
Figure 9
Figure 9
(ae). Metabolic imaging of FAD using multiple components. FAD FLIM data of hepatocytes and cancer cells of metastatic pancreatic cancer (panels adapted with permission from [48]). (a) Phasor plot showing linear combination of two components, short lifetime (protein-bound FAD, blue cursor) and long-lifetime (free FAD, orange cursor). (b) Grayscale (accumulated photon counts) of hepatic cells. (c) Pseudo-color image showing different lifetime species in the short-lifetime hepatocytes (SLH) and long-lifetime cancer cells (LLC). (d) Lifetimes and ratios (Rb-FAD) of the components. (e,f) FAD FLIM data of adipocytes of metastatic pancreatic cancer. (e) Phasor plot showing three-component analysis, short lifetime (protein-bound FAD, blue cursor), long-lifetime (free FAD, orange cursor) and another much longer lifetime component (red cursor). (f) Grayscale (accumulated photon counts) of adipose cells. (g) Pseudo-color image showing different lifetime species in the short-lifetime adipose (SLA) and long-lifetime adipose cells (LLA). (h) Lifetimes and ratios (Rb-FAD) of the components. (i) Metabolic features of liver section (large-field image) of metastatic colonization revealed using FLIM. (Panels adapted with permission from [48]).
Figure 10
Figure 10
Multiple-component fraction analysis (known lifetimes of the components) to calculate average from an image. (ac) Three-Component fraction analysis (known lifetimes of the components). Obtaining intensity fractions of three nuclear dyes mixed in live cells with three-component analysis. (a) Representative images of three different cells, all of them stained with the three nuclear dyes: Acridine Orange (Fraction 1, F1), NucBlue (F2) and Rose Bengal (F3). Total intensity (column 1) and normalized recovered images of the intensity fractions (average fraction written in white) of the three dyes are shown in columns 2–4. (b) Phasor plot corresponding to 47 different cells. The colored circles indicate in the phasor plot the phasor position for the first harmonic at 80MHz of Acridine Orange (red circle), NucBlue (green circle) and Rose Bengal (blue circle). (c) Fractional intensity values obtained with the three-component analysis of 16 cells. (d) Four-Component analysis (known lifetimes of the components) using harmonics. (Panel adapted with permission from [35]). Phasor plot corresponding to 22 different mixtures of 9(10H)-Acridanone (red circle, 12 ns), Rhodamine 110 (green circle, 3.8 ns), POPOP (blue circle, 1.4 ns), and NADH (orange circle, 0.4 ns) (phasor positions of the pure single exponential species on the universal semicircle are shown by circles). To solve the four-component system, the phasor plot was measured at 80MHz (first harmonic) and 160 MHz (second harmonic, not shown). (Panels adapted with permission from [35]).
Figure 11
Figure 11
Quantification and visualization of minocycline (MNC), tazarotene (TAZ) in ex vivo skin samples. Quantification of the drug distribution for the three components: MNC, TAZ and autofluorescence based on the ono-Euclidean geometry results in distribution patterns for the three components, as shown by yellow for AF, cyan for TAZ, and magenta for MNC, respectively. The scale bar is 100 μm. (Figure adapted from [36]).
Figure 12
Figure 12
Biological example of three-component blind analysis (unknown lifetimes of the components) using harmonics of phasor. Study of metabolic changes in liver tissue samples using three-component blind recovery analysis. (a) Intensity images of livers of mice fed with low-fat diet (LF, top) or Western diet (WD, bottom) (b) Recovered lifetimes using three blind components are represented as gray violin plots and the median ± SD. Expected lifetime values for individual species are shown with a horizontal red line. (c) Phasor plot for the first harmonic (second and third harmonics phasor plots are not shown). Colored circles on the universal circle indicate the recovered first harmonic phasor position of free NADH (cyan), protein-bound NADH (purple), and LLS (yellow). Fractional intensity distributions of the three components in LF (d) and WD (e) samples. Color-coded phasor-FLIM liver images of mice fed with LF (f) or WD (g). The free-to-protein-bound ratio (not including LLS) is color-coded using a magenta to cyan colormap with a yellow overlay for LLS (with values above 75%). (Panels adapted with permission from [38]).
Figure 13
Figure 13
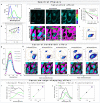
Spectral phasor transformation properties and important considerations. (a,b) Simulation of two gaussian curves with different centers of mass and FWHM (a), and the transformation into the spectral phasor plot (b). Note that while the blue curve has a longer M and short Φ (meaning bluer and narrow spectra), the green curve has a shorter M and larger Φ (meaning greener and broader spectra). The line that joins the two components represents the linear combination for all the different fractions between component 1 and 2. (cf) Effect of the spectral saturation on the spectral phasor transformation. (c) Spectral and (d) pseudo-color images of HeLa cells stained with ACDAN (5 µM final concentration), imaged at different laser powers (with increasing saturation from left to right). Scale bar 10 μm. (e) The corresponding intensity histograms. (f) Based on a set of cursors in the phasor plot for the no-saturation condition, the effect of saturation and changes in the location of the phasor cloud by aberrant transformation can be seen. The phasor plot consists of the clouds from the three images (no-saturation, small-saturation, saturation). (g,h) Effect of the spectral bandwidth on the spectral phasor transformation. (g) The average spectra of the pixels from each image are shown here (8, 16, 32, 64 and 96 channels, respectively). Note that counts were kept in a similar range for comparison purposes. The data were acquired using a 32-channel spectral on the Zeiss LSM 710, therefore by default it records spectra using 32 parallel channels. Note that increasing resolution (increasing number of channels and decreasing the bandwidth per channel) of the phasor transformation results in a broader cloud (due to the poorer S/N per channel). The second noticeable difference is the time it takes to acquire the image due to the wavelength scanning needed for higher resolutions. Analyzing the image quality for the different configurations, it is simple to note that 32 channels is optimal in terms of image speed and resolution. (i,j) Improper spectral phasor transformation by the spectrum edge-chopping. In this example fluorescence spectra from Nile Red in phospholipid (PL) or triglyceride (TAG) (obtained from https://www.thermofisher.com/order/fluorescence-spectraviewer#!/, accessed on 25 November 2021) were transformed into spectral phasors using Equations (13) and (14). (i) the spectral range was chopped from both sides. The linear combination breaks down in this case (black triangle, 50:50 of each) due to the improper transformation. (j) Same set of data, but using the entire spectra results in a proper transformation and the linear combination is valid.
Figure 14
Figure 14
Analysis of the lipid metabolic profile of EGFP+ cells in the zebrafish line with the transgene fabp4 (−2.7): EGFPcaax. (ad) Schematic representation of the three-component analysis for the Nile Red fluorescence in the presence or absence of the EGFP fluorescence. EGFP− cells let us define the neutral-polar Nile Red trajectory and EGFP+ cells without Nile Red, allowing us to identify the phasor position of the third component (GFP, identifying the specific cell-adipocyte). Notice that after three cursors were defined, a triangle has all possible linear combinations, and the third component was used to analyze the Nile Red information from the cells of interest. Two scales of colors were defined for the Nile Red profile and the EGFP profile. (eg) Examples for the analysis of the Nile Red profile in two cells from the zebrafish larvae with the transgene fabp4(−2.7): EGFPcaax at 8 dpf. Notice that the Nile Red spectrum characteristic in the EGFP+ cell is pulled towards the third component, which enables the identification and analysis of the Nile Red profile for these cells avoiding confusing the information coming from Nile Red in GFP− tissue. (h) “Nile Red axis” is defined as a normalized fraction of pixels along the Nile Red profile. The histogram shows the percentage of polar lipids in the region of the cell analyzed. Scale bars: A: 20 μm; B: 50 μm. (Panels adapted with permission from [56]).

Similar articles

Cited by

References

    1. Malacrida L., Ranjit S., Jameson D.M., Gratton E. The Phasor Plot: A Universal Circle To Advance Fluorescence Lifetime Analysis And Interpretation. Annu. Rev. Biophys. 2021;50:575–593. doi: 10.1146/annurev-biophys-062920-063631. - DOI - PubMed
    1. Weber G. Resolution of the Fluorescence Lifetimes in A Heterogeneous System by Phase and Modulation Measurements. J. Phys. Chem. 1981;85:949–953. doi: 10.1021/j150608a006. - DOI
    1. Jameson D.M., Gratton E., Hall R.D. The Measurement and Analysis of Heterogeneous Emissions by Multifrequency Phase and Modulation Fluorometry. Appl Spectrosc. Rev. 1984;20:55–106. doi: 10.1080/05704928408081716. - DOI - PubMed
    1. Digman M.A., Caiolfa V.R., Zamai M., Gratton E. The Phasor Approach to Fluorescence Lifetime Imaging Analysis. Biophys. J. 2008;94:L14–L16. doi: 10.1529/biophysj.107.120154. - DOI - PMC - PubMed
    1. Stringari C., Cinquin A., Cinquin O., Digman M.A., Donovan P.J., Gratton E. Phasor Approach to Fluorescence Lifetime Microscopy Distinguishes Different Metabolic States of Germ Cells in A Live Tissue. Proc. Natl. Acad. Sci. USA. 2011;108:13582–13587. doi: 10.1073/pnas.1108161108. - DOI - PMC - PubMed

Substances

LinkOut - more resources