

Automated Assessment of Cardiovascular Sufficiency Using Non-Invasive Physiological Data
- PMID: 35161770
- PMCID: PMC8839064
- DOI: 10.3390/s22031024
Automated Assessment of Cardiovascular Sufficiency Using Non-Invasive Physiological Data
Abstract
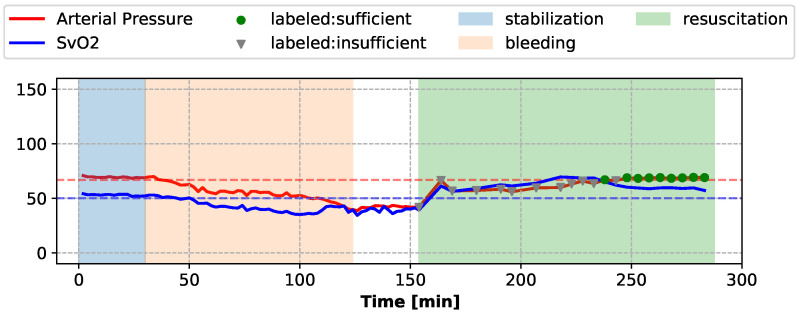
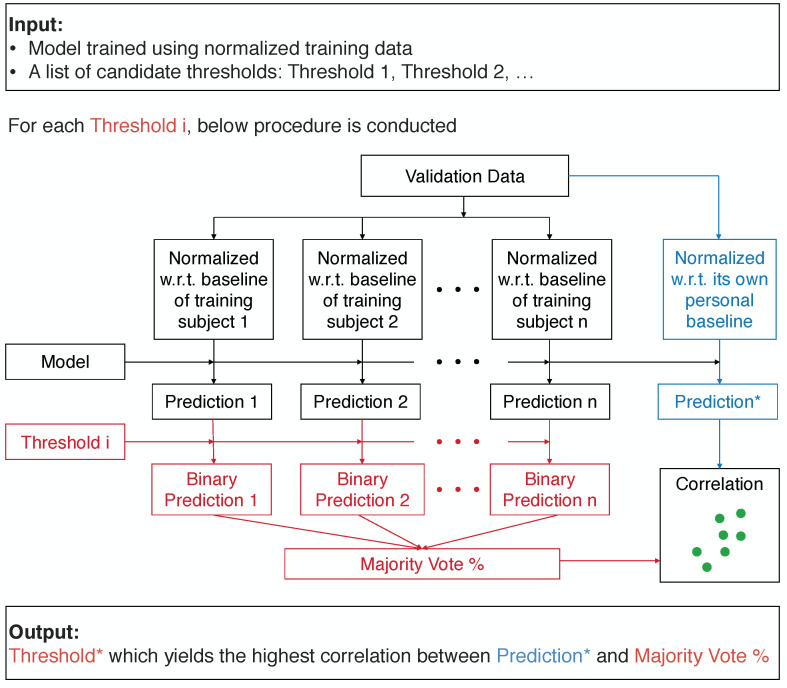
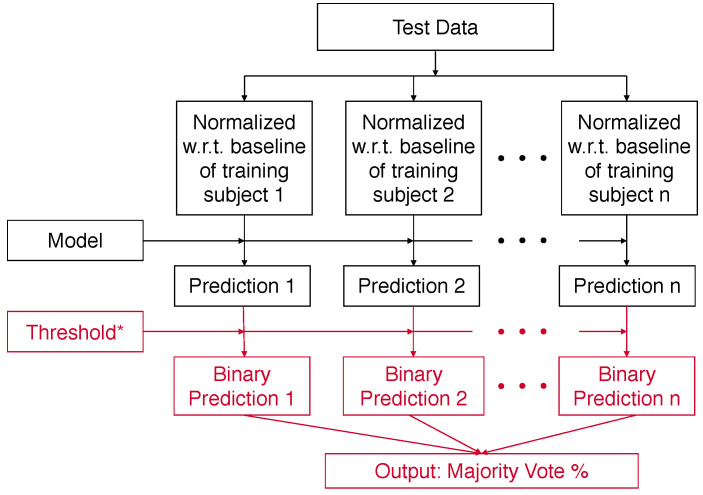
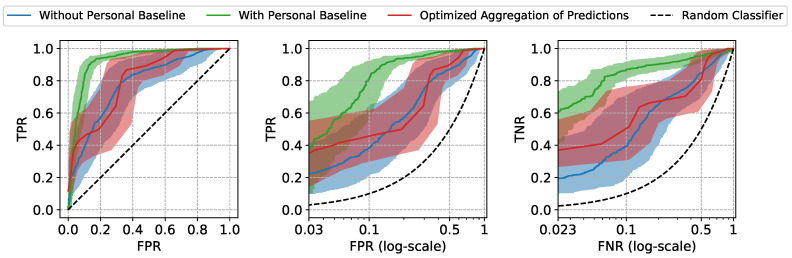
For fluid resuscitation of critically ill individuals to be effective, it must be well calibrated in terms of timing and dosages of treatments. In current practice, the cardiovascular sufficiency of patients during fluid resuscitation is determined using primarily invasively measured vital signs, including Arterial Pressure and Mixed Venous Oxygen Saturation (SvO2), which may not be available in outside-of-hospital settings, particularly in the field when treating subjects injured in traffic accidents or wounded in combat where only non-invasive monitoring is available to drive care. In this paper, we propose (1) a Machine Learning (ML) approach to estimate the sufficiency utilizing features extracted from non-invasive vital signs and (2) a novel framework to address the detrimental impact of inter-patient diversity on the ability of ML models to generalize well to unseen subjects. Through comprehensive evaluation on the physiological data collected in laboratory animal experiments, we demonstrate that the proposed approaches can achieve competitive performance on new patients using only non-invasive measurements. These characteristics enable effective monitoring of fluid resuscitation in real-world acute settings with limited monitoring resources and can help facilitate broader adoption of ML in this important subfield of healthcare.
Keywords: cardiovascular sufficiency; fluid resuscitation; machine learning; non-invasive monitoring; physiological data.
Conflict of interest statement
The authors declare no conflict of interest.
Figures
Similar articles
-
[Experts consensus on the management of the right heart function in critically ill patients].Zhonghua Nei Ke Za Zhi. 2017 Dec 1;56(12):962-973. doi: 10.3760/cma.j.issn.0578-1426.2017.12.017. Zhonghua Nei Ke Za Zhi. 2017. PMID: 29202543 Chinese.
-
Continuous cardiac output and mixed venous oxygen saturation monitoring.J Crit Care. 1998 Dec;13(4):198-213. doi: 10.1016/s0883-9441(98)90006-5. J Crit Care. 1998. PMID: 9869547 Review.
-
Retinal oxygen saturation as a non-invasive estimate for mixed venous oxygen saturation and cardiac output.Acta Ophthalmol. 2019 Mar;97(2):e308-e312. doi: 10.1111/aos.13890. Epub 2018 Oct 2. Acta Ophthalmol. 2019. PMID: 30280510
-
Physiological and medical monitoring for en route care of combat casualties.J Trauma. 2008 Apr;64(4 Suppl):S342-53. doi: 10.1097/TA.0b013e31816c82f4. J Trauma. 2008. PMID: 18385586 Review.
-
High mixed venous oxygen saturation levels do not exclude fluid responsiveness in critically ill septic patients.Crit Care. 2011 Jul 26;15(4):R177. doi: 10.1186/cc10326. Crit Care. 2011. PMID: 21791090 Free PMC article.
Cited by
-
Noninvasive Monitoring of Simulated Hemorrhage and Whole Blood Resuscitation.Biosensors (Basel). 2022 Dec 14;12(12):1168. doi: 10.3390/bios12121168. Biosensors (Basel). 2022. PMID: 36551134 Free PMC article.
References
MeSH terms
Grants and funding
LinkOut - more resources
Full Text Sources
