Review
. 2022 Jan 30;22(3):1086.
doi: 10.3390/s22031086.

Microscopies Enabled by Photonic Metamaterials

Affiliations
Review

Microscopies Enabled by Photonic Metamaterials

Yanyu Xiong et al. Sensors (Basel). .

Abstract

In recent years, the biosensor research community has made rapid progress in the development of nanostructured materials capable of amplifying the interaction between light and biological matter. A common objective is to concentrate the electromagnetic energy associated with light into nanometer-scale volumes that, in many cases, can extend below the conventional Abbé diffraction limit. Dating back to the first application of surface plasmon resonance (SPR) for label-free detection of biomolecular interactions, resonant optical structures, including waveguides, ring resonators, and photonic crystals, have proven to be effective conduits for a wide range of optical enhancement effects that include enhanced excitation of photon emitters (such as quantum dots, organic dyes, and fluorescent proteins), enhanced extraction from photon emitters, enhanced optical absorption, and enhanced optical scattering (such as from Raman-scatterers and nanoparticles). The application of photonic metamaterials as a means for enhancing contrast in microscopy is a recent technological development. Through their ability to generate surface-localized and resonantly enhanced electromagnetic fields, photonic metamaterials are an effective surface for magnifying absorption, photon emission, and scattering associated with biological materials while an imaging system records spatial and temporal patterns. By replacing the conventional glass microscope slide with a photonic metamaterial, new forms of contrast and enhanced signal-to-noise are obtained for applications that include cancer diagnostics, infectious disease diagnostics, cell membrane imaging, biomolecular interaction analysis, and drug discovery. This paper will review the current state of the art in which photonic metamaterial surfaces are utilized in the context of microscopy.

Keywords: biomolecular detection; biosensor; fluorescence; label-free; microscopy; photonic crystals; photonic metamaterials; plasmonic.


Conflict of interest statement

The authors declare no conflict of interest.

Figures

Figure 10
Figure 10
Metamaterial-based super resolution microscopy. (a). Diffraction limited image using conventional epifluorescence. Scale: 20 μm (b) speckle-MAIN image with improved spatial resolution. Reprinted from Ref. [98]. (c) the dispersion relation for SIM, PSIM and MAIN and their corresponding k-space shift in Fourier plane.
Figure 12
Figure 12
SEM images of meta-surfaces fabricated by various nanofabrication technology (a) Cross-sectional view of 3-D helical nanostructures fabricated by direct writing laser, Reprinted with permission from Ref. [148]. Copyright 2009 American Association for the Advancement of Science.; (b) A large array of rod shape by interference lithography for surface-enhanced infrared absorption. Reprinted with permission from Ref. [149]. Copyright 2014 WILEY-VCH Verlag GmbH & Co. KGaA, Weinheim. (c) An array of gold nanodisk array with sub-10 nm nanogaps produced by electron-beam lithography. Reprinted with permission from Ref. [116]. Copyright 2011 American Chemical Society. (d) An array of nanoribbons with 20 nm width produced by focused ion beam. Reprinted with permission from Ref. [126]. Copyright 2022 IOP Publishing. (e) A several-centimeter scale of nanopatterns of PET materials produced by nanoimprint without photoresist. Reprinted with permission from Ref. [150]. Copyright 2019 American Chemical Society. (f) 2-D photonic crystals fabricated by nanoimprint with photoresist. Reprinted with permission from Ref. [76]. Copyright 2014 The Royal Society of Chemistry; (g) an array of nanoline patterns consisting of serially connected nanorods via dip-coating using wrinkled PDMS substrates as templates. Reprinted with permission from Ref. [151]. Copyright 2014 American Chemical Society. (h) An array of self-assembled silver nanocubes with an average edge length of 93 ± 4 nm produced by nontemplate self-assembly. Reprinted with permission from Ref. [152]. Copyright 2016 American Chemical Society.
Figure 1
Figure 1
Metasurface-based phase contrast microscopy. (a) Schematic of the surface plasmon enhanced ptychographic phase microscope. (b) SEM image of the nanostructured metasurface for surface plasmon generation. Sale bar: 450 nm. (c) Ptychographic reconstructed phase image of an unstained tissue section. (d) Metasurface-enhanced ptychographic phase image of the same tissue sample shown in (c). Scale bar: 25 μm. Reprinted with permission from Ref. [54]. Copyright 2021 Springer Nature. (e) Schematic of the compact metasurface-based quantitative phase microscope. (f) Three differential interference contrast (DIC) images obtained by the metasurfaces. Scale bar: 50 μm. (g) Reconstructed phase image of the target in (f). Scale bar: 50 μm. Reprinted with permission from Ref. [55]. Copyright 2019 Springer Nature.
Figure 2
Figure 2
Metasurface-enabled darkfield microscopy. (a) Left: Schematic of the luminescent photonic substrate. Right: Darkfield image of a micro-algae on the nanophotonic substrate. Scale bar: 5 μm. (b) Schematic drawing of the microscope used for imaging with the luminescent surface as the imaging substrate. Reprinted with permission from Ref. [57]. Copyright 2020 Springer Nature. (c) Design of the planar photonic chip for darkfield illumination (at 750 nm excitation) and total internal reflection imaging (at 640 nm excitation). (d) Imaging demonstration of two polymer nanowires. Scar bar: 20 μm. Reprinted from Ref. [58].
Figure 3
Figure 3
Metasurface-based refractometric microscopy for biomolecular sensing. (a) The single-wavelength algorithm with spectral displacement reconstruction assists the principle of imaging biosensors. A sketch of the real-time flow into the imaging platform shows a 2D microarray of all-dielectric sensors integrated with a microfluidic unit composed of three independent flow channels. Biomarker binding can be detected by tracking the resonance wavelength or by the intensity change (ΔI) at a fixed detection wavelength (λp). Reprinted from Ref. [60]. (b) Reconstructed spectral shift (Δλ) calibration curve of biotinylated silica nanoparticles. Reprinted from Ref. [60] (c) Nanoparticle-enhanced plasmonic imager is used to detect the antigen (red) that has been recognized by the capture antibody (blue) immobilized on the Au-NHA, and then is recognized by the detection antibody (green) attached to the Au-NPs. To achieve the purpose of detection and precise image processing, the transmission signal is displayed as an image heat map through the plasmonic NHA chip and CMOS camera, thereby realizing the digital detection of biomolecules. Reprinted from Ref. [61]. (d) Process of using DENIS to detect and quantify PCT and CRP, including the mixing and loading of serum samples, and the signal output through Au-NHA chip. Reprinted from Ref. [60].
Figure 4
Figure 4
Metasurface-based refractometric label-free microscopy for cell morphology. (a) Schematic of the photonic-crystal-enhanced microscopy (PCEM) instrument. (b) Bright field (left) and PWV imaging (right) of Panc-1 cells attached to the PC surface. Reprinted with permission from Ref. [64]. Copyright 2013 The Royal Society of Chemistry. (c) SEM image of the dielectric nanohole array and simulated electric field at resonance in the inset. (d) Bright field (left) versus hyperspectral (right) imaging of an individual Escherichia coli obtained with a dielectric nanohole array. Reprinted from Ref. [68].
Figure 5
Figure 5
Metamaterial-Enhanced Interferometric Scattering Microscopy (a) Schematic of the photonic resonator interferometric scattering microscopy (PRISM) instrument. Inset: detection scheme for label-free detection of pseudotyped SARS-CoV-2 using DNA aptamers. (b) Selectivity and (c) sensitivity of the PRISM-based SARS-CoV-2 biosensor. Error bars represent the standard deviations of at least three independent measurements. (* significant; ** very significant; *** and **** extremely significant.) Reprinted from Ref. [71].
Figure 6
Figure 6
PCEM detection of protein–protein binding. (a) Schematic illustration of the attachment of AuNR–IgG (AuNR conjugated with SH-PEG–IgG) on a PC biosensor surface. (b) SEM images of AuNR–IgG attached to the PC biosensor surface. Inset: Zoomed-in image. (c) PCEM detected PIV images and the difference between without and with AuNR–IgG on the PC surface. (d) Two representative cross-section lines of the normalized intensity images with/without two AuNRs-IgG on the PC surface. Reprinted with permission from Ref. [76]. Copyright 2014 The Royal Society of Chemistry.
Figure 7
Figure 7
Detection of microRNA with digital-resolution and single-base selectivity by photonic resonator absorption microscopy. (a) Components of the toehold DNA–AuNP and miR detection by PC biosensors. (i) The DNA probe (green color) is bound by a protector (blue color, partially complementary) which prevents binding to the PC sensor. (iiiv) target miR (red color) binds as toehold (ii), resulting in strand displacement of the protector (iii), which (iv) stabilizes probe binding to the capture DNA on the PC surface (iv). (b) PRAM instrument schematic (c) Simulated reflectance spectrum of the PC alone (blue) and the AuNP–PC hybrid (red). According to simulation, hybrid formation results in a reflectance peak wavelength shift (Δλ) to 628 nm from 625 nm and a reflectance peak intensity drop (ΔI). (d) A 2D gray-scale PRAM image (Upper left) is represented in the 3D contour plot (Lower right), demonstrating the individual AuNP peak intensity shifts. Reprinted from Ref. [77].
Figure 8
Figure 8
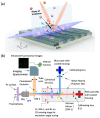
Photonic Crystal enhanced Fluorescence (PCEF). Schematic of (a) PC-enhanced Fluorescence platform using [82] and (b) objective-coupled line-scanning PCEF microscope. Two selectable incident beams are represented in blue and red illumination paths. The collection fluorescent beam paths overlap in the region between the dichroic mirror 2, PC and objective lens are represented in orange.
Figure 9
Figure 9
PCEF applications in bio-imaging. (a) PC band-diagram design for fluorescent enhancement. (b) Fluorescent images of micro-spots from the TNF-α and IL-3 sandwich immunoassay [83]. (c,d) Integrated microfluidic PCEF scanning system with pg/mL-level limits of detection. Reprinted with permission from Ref. [84] Copyright 2015 Elsevier B.V. (e) Fluorescence microscope images of labeled cells on different substrates. Top left: lateral grating plate. Top right: longitudinal grating plate. Bottom left: glass slide with coating. Bottom right: uncoated normal glass slide. Bar corresponds to 10 μm. Reprinted with permission from Ref. [85] Copyright 2015 The Optical Society.
Figure 11
Figure 11
Existing methods for fabricating metamaterials. Schematic of the (a) Direct writing laser. Reprinted with permission from Ref. [106]. Copyright 2015 American Chemical Society. (b) Interference lithography. Reprinted from refs. [106,107]. (c) Electron beam lithography. Reprinted from Ref. [108]. (d) Focused ion beam. Reprinted from Ref. [109]. (e) Nanoimprint without photoresist. Reprinted from Ref. [110]. (f) Nanoimprint with photoresist. Reprinted with permission from Ref. [76]. Copyright 2014 The Royal Society of Chemistry. (g) Template-assisted self-assembly. Reprinted from Ref. [111]. (h) Non-template self-assembly. Reprinted with permission from Ref. [112]. Copyright 2013 WILEY-VCH Verlag GmbH & Co. KGaA.

Similar articles

Cited by

References

    1. Chen S., Svedendahl M., Antosiewicz T.J., Kall M. Plasmon-enhanced enzyme-linked immunosorbent assay on large arrays of individual particles made by electron beam lithography. ACS Nano. 2013;7:8824–8832. doi: 10.1021/nn403287a. - DOI - PubMed
    1. Spindler S., Ehrig J., König K., Nowak T., Piliarik M., Stein H.E., Taylor R.W., Garanger E., Lecommandoux S., Alves I.D. Visualization of lipids and proteins at high spatial and temporal resolution via interferometric scattering (iSCAT) microscopy. J. Phys. D Appl. Phys. 2016;49:274002. doi: 10.1088/0022-3727/49/27/274002. - DOI
    1. Sevenler D., Daaboul G.G., Ekiz Kanik F., Ünlü N.e.L., Ünlü M.S. Digital microarrays: Single-molecule readout with interferometric detection of plasmonic nanorod labels. ACS Nano. 2018;12:5880–5887. doi: 10.1021/acsnano.8b02036. - DOI - PubMed
    1. Sevenler D., Trueb J., Ünlü M.S. Beating the reaction limits of biosensor sensitivity with dynamic tracking of single binding events. Proc. Natl. Acad. Sci. USA. 2019;116:4129–4134. doi: 10.1073/pnas.1815329116. - DOI - PMC - PubMed
    1. Young G., Hundt N., Cole D., Fineberg A., Andrecka J., Tyler A., Olerinyova A., Ansari A., Marklund E.G., Collier M.P. Quantitative mass imaging of single biological macromolecules. Science. 2018;360:423–427. doi: 10.1126/science.aar5839. - DOI - PMC - PubMed

LinkOut - more resources