

A Wearable Multimodal Sensing System for Tracking Changes in Pulmonary Fluid Status, Lung Sounds, and Respiratory Markers
- PMID: 35161876
- PMCID: PMC8838360
- DOI: 10.3390/s22031130
A Wearable Multimodal Sensing System for Tracking Changes in Pulmonary Fluid Status, Lung Sounds, and Respiratory Markers
Abstract
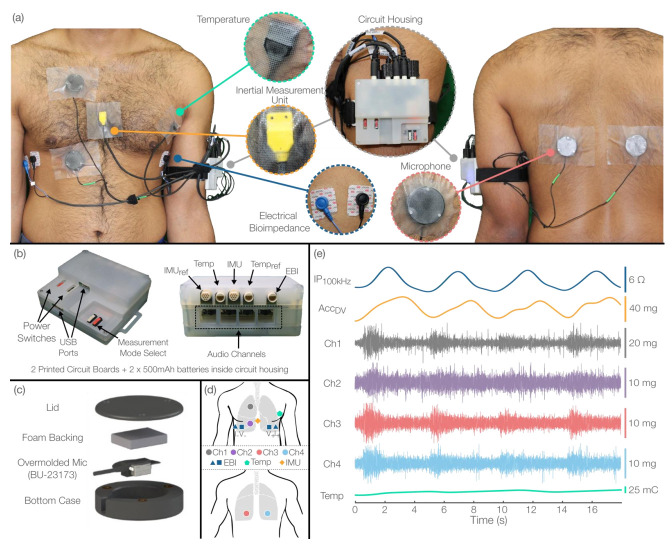
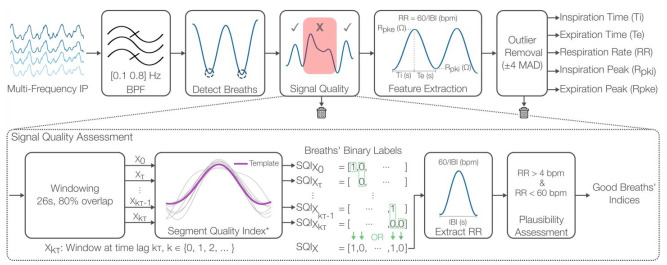
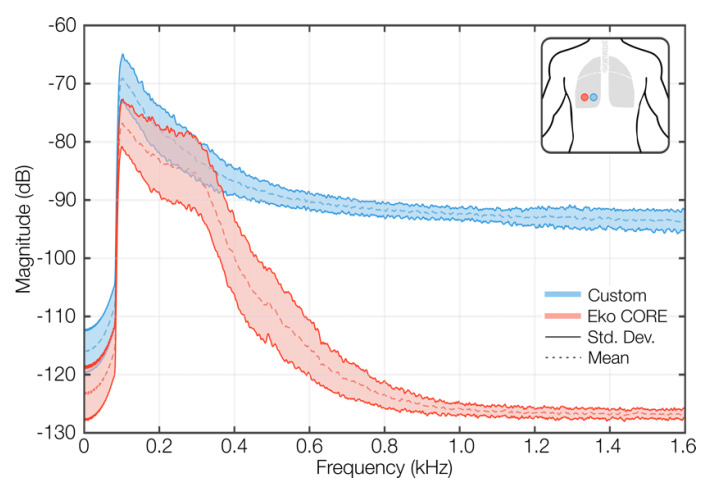
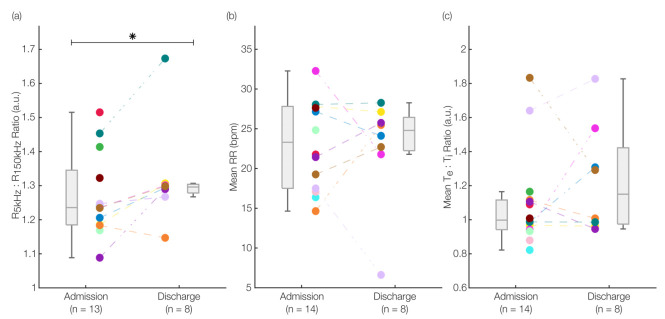
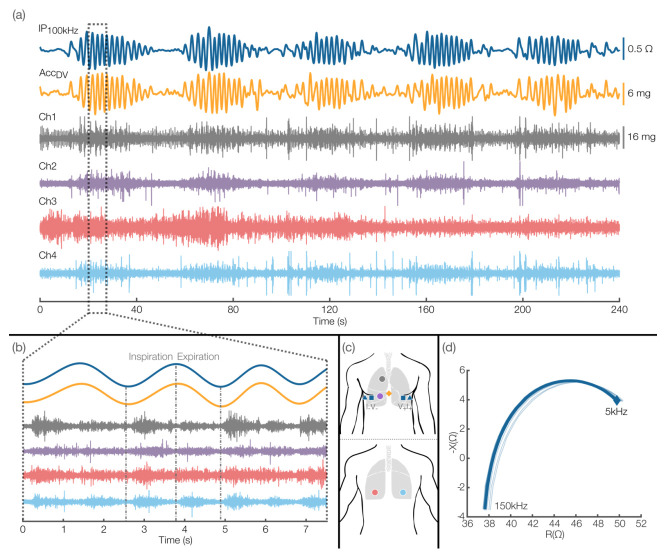
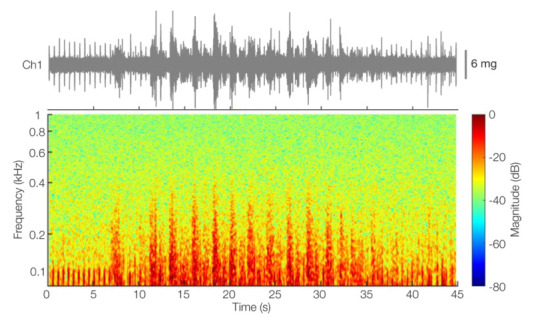
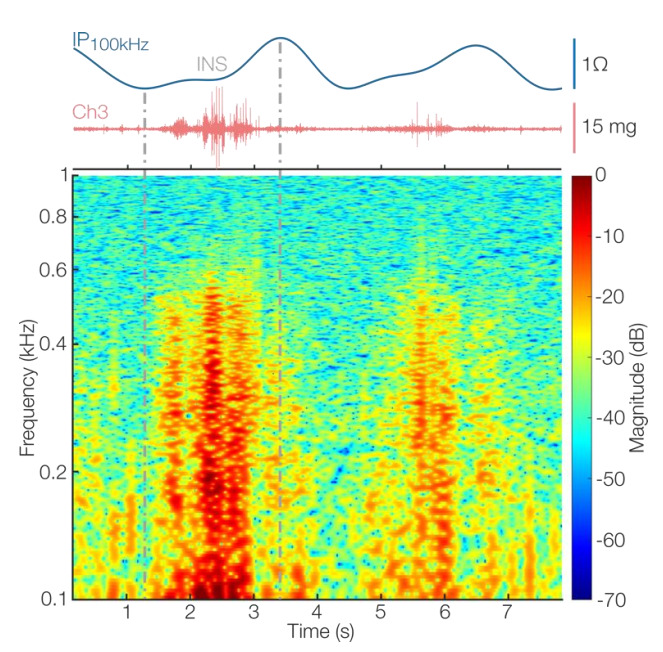
Heart failure (HF) exacerbations, characterized by pulmonary congestion and breathlessness, require frequent hospitalizations, often resulting in poor outcomes. Current methods for tracking lung fluid and respiratory distress are unable to produce continuous, holistic measures of cardiopulmonary health. We present a multimodal sensing system that captures bioimpedance spectroscopy (BIS), multi-channel lung sounds from four contact microphones, multi-frequency impedance pneumography (IP), temperature, and kinematics to track changes in cardiopulmonary status. We first validated the system on healthy subjects (n = 10) and then conducted a feasibility study on patients (n = 14) with HF in clinical settings. Three measurements were taken throughout the course of hospitalization, and parameters relevant to lung fluid status-the ratio of the resistances at 5 kHz to those at 150 kHz (K)-and respiratory timings (e.g., respiratory rate) were extracted. We found a statistically significant increase in K (p < 0.05) from admission to discharge and observed respiratory timings in physiologically plausible ranges. The IP-derived respiratory signals and lung sounds were sensitive enough to detect abnormal respiratory patterns (Cheyne-Stokes) and inspiratory crackles from patient recordings, respectively. We demonstrated that the proposed system is suitable for detecting changes in pulmonary fluid status and capturing high-quality respiratory signals and lung sounds in a clinical setting.
Keywords: bioimpedance spectroscopy; cardiorespiratory monitoring; fluid status; heart failure; impedance pneumography; lung sounds; sensor fusion; wearable sensing.
Conflict of interest statement
The authors declare no conflict of interest.
Figures
Similar articles
-
Towards Estimation of Tidal Volume and Respiratory Timings via Wearable-Patch-Based Impedance Pneumography in Ambulatory Settings.IEEE Trans Biomed Eng. 2022 Jun;69(6):1909-1919. doi: 10.1109/TBME.2021.3130540. Epub 2022 May 19. IEEE Trans Biomed Eng. 2022. PMID: 34818186 Free PMC article.
-
Detection of pathological mechano-acoustic signatures using precision accelerometer contact microphones in patients with pulmonary disorders.Sci Rep. 2021 Jun 28;11(1):13427. doi: 10.1038/s41598-021-92666-2. Sci Rep. 2021. PMID: 34183695 Free PMC article.
-
The Added Value of In-Hospital Tracking of the Efficacy of Decongestion Therapy and Prognostic Value of a Wearable Thoracic Impedance Sensor in Acutely Decompensated Heart Failure With Volume Overload: Prospective Cohort Study.JMIR Cardio. 2020 Mar 18;4(1):e12141. doi: 10.2196/12141. JMIR Cardio. 2020. PMID: 32186520 Free PMC article.
-
The lung water cascade in heart failure.Echocardiography. 2017 Oct;34(10):1503-1507. doi: 10.1111/echo.13657. Epub 2017 Aug 28. Echocardiography. 2017. PMID: 28849591 Review.
-
Lung and Heart Sounds Analysis: State-of-the-Art and Future Trends.Crit Rev Biomed Eng. 2018;46(1):33-52. doi: 10.1615/CritRevBiomedEng.2018025112. Crit Rev Biomed Eng. 2018. PMID: 29717676 Review.
Cited by
-
Localized Multi-Site Knee Bioimpedance as a Predictor for Knee Osteoarthritis Associated Pain Within Older Adults During Free-Living.IEEE Open J Eng Med Biol. 2023 Mar 13;4:1-10. doi: 10.1109/OJEMB.2023.3256181. eCollection 2023. IEEE Open J Eng Med Biol. 2023. PMID: 37138591 Free PMC article.
-
Regional Pulmonary Ventilation Assessment Method and System Based on Impedance Sensing Information from the Pentapulmonary Lobes.Sensors (Basel). 2024 May 17;24(10):3202. doi: 10.3390/s24103202. Sensors (Basel). 2024. PMID: 38794056 Free PMC article.
-
Wearable Devices Based on Bioimpedance Test in Heart Failure: Clinical Relevance: Systematic Review.Rev Cardiovasc Med. 2024 Sep 6;25(9):315. doi: 10.31083/j.rcm2509315. eCollection 2024 Sep. Rev Cardiovasc Med. 2024. PMID: 39355607 Free PMC article.
-
Digital Pulmonology Practice with Phonopulmography Leveraging Artificial Intelligence: Future Perspectives Using Dual Microwave Acoustic Sensing and Imaging.Sensors (Basel). 2023 Jun 12;23(12):5514. doi: 10.3390/s23125514. Sensors (Basel). 2023. PMID: 37420680 Free PMC article. Review.
-
A scoping review on advancements in noninvasive wearable technology for heart failure management.NPJ Digit Med. 2024 Oct 12;7(1):279. doi: 10.1038/s41746-024-01268-5. NPJ Digit Med. 2024. PMID: 39396094 Free PMC article.
References
-
- Virani S.S., Alonso A., Benjamin E.J., Bittencourt M.S., Callaway C.W., Carson A.P., Chamberlain A.M., Chang A.R., Cheng S., Delling F.N., et al. Heart disease and stroke statistics-2020 update: A report from the american heart association. Circulation. 2020;141:E139–E596. doi: 10.1161/CIR.0000000000000757. - DOI - PubMed
-
- Solomon S.D., Dobson J., Pocock S., Skali H., Mcmurray J., Granger C.B., Yusuf S., Swedberg K., Young J.B., Michelson E.L., et al. Influence of nonfatal hospitalization for heart failure on subsequent mortality in patients with chronic heart failure. Circulation. 2007;116:1482–1487. doi: 10.1161/CIRCULATIONAHA.107.696906. - DOI - PubMed
-
- Ambrosy A.P., Pang P.S., Khan S., Konstam M.A., Fonarow G.C., Traver B., Maggioni A.P., Cook T., Swedberg K., Burnett J.C., et al. Clinical course and predictive value of congestion during hospitalization in patients admitted for worsening signs and symptoms of heart failure with reduced ejection fraction: Findings from the EVEREST trial. Eur. Heart J. 2013;34:835–843. doi: 10.1093/eurheartj/ehs444. - DOI - PubMed
MeSH terms
Grants and funding
LinkOut - more resources
Full Text Sources
Other Literature Sources
Medical
Research Materials
Miscellaneous
