

Assessing Trauma Center Accessibility for Healthcare Equity Using an Anti-Covering Approach
- PMID: 35162486
- PMCID: PMC8835095
- DOI: 10.3390/ijerph19031459
Assessing Trauma Center Accessibility for Healthcare Equity Using an Anti-Covering Approach
Abstract
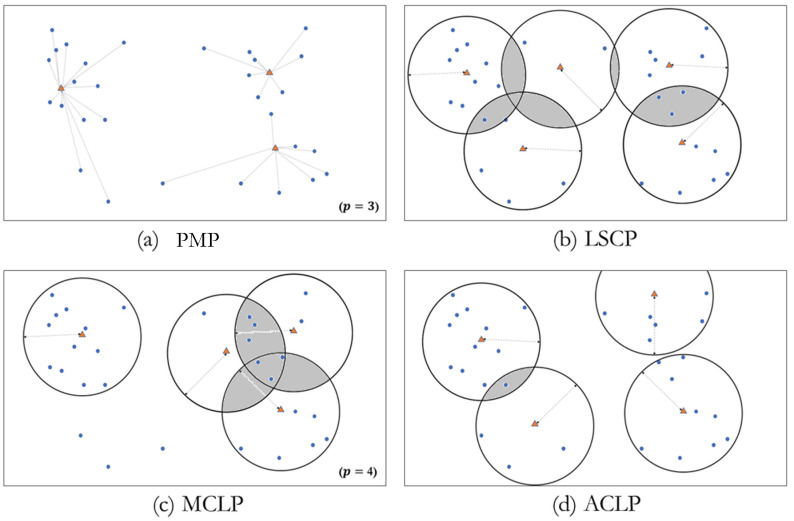
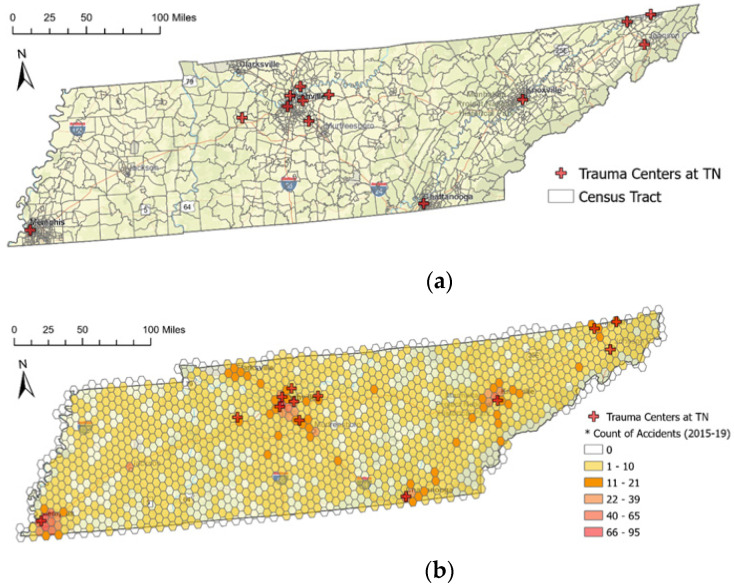
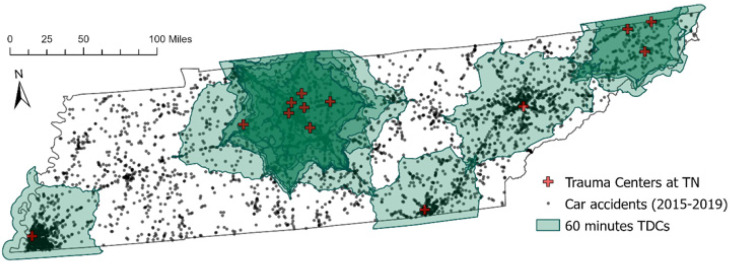
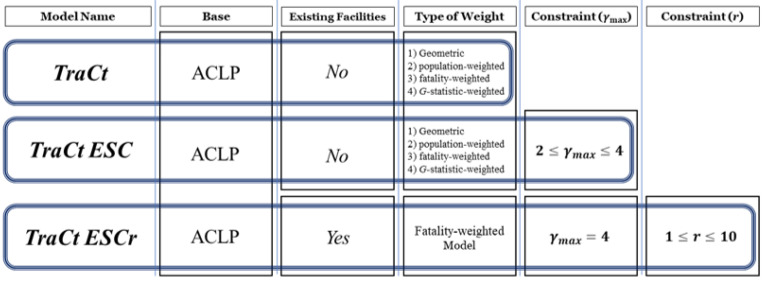
Motor vehicle accidents are one of the most prevalent causes of traumatic injury in patients needing transport to a trauma center. Arrival at a trauma center within an hour of the accident increases a patient's chances of survival and recovery. However, not all vehicle accidents in Tennessee are accessible to a trauma center within an hour by ground transportation. This study uses the anti-covering location problem (ACLP) to assess the current placement of trauma centers and explore optimal placements based on the population distribution and spatial pattern of motor vehicle accidents in 2015 through 2019 in Tennessee. The ACLP models seek to offer a method of exploring feasible scenarios for locating trauma centers that intend to provide accessibility to patients in underserved areas who suffer trauma as a result of vehicle accidents. The proposed ACLP approach also seeks to adjust the locations of trauma centers to reduce areas with excessive service coverage while improving coverage for less accessible areas of demand. In this study, three models are prescribed for finding optimal locations for trauma centers: (a) TraCt: ACLP model with a geometric approach and weighted models of population, fatalities, and spatial fatality clusters of vehicle accidents; (b) TraCt-ESC: an extended ACLP model mitigating excessive service supply among trauma center candidates, while expanding services to less served areas for more beneficiaries using fewer facilities; and (c) TraCt-ESCr: another extended ACLP model exploring the optimal location of additional trauma centers.
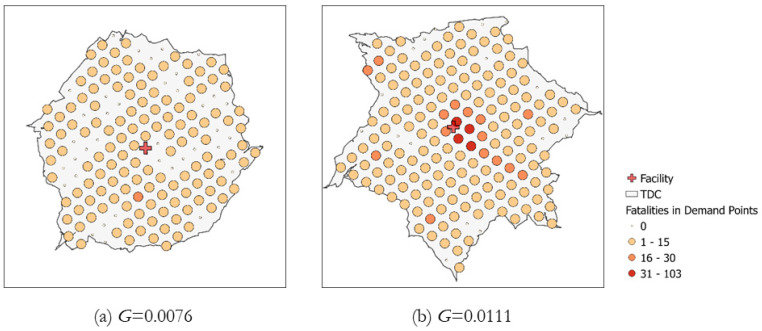
Keywords: ACLP; Getis–Ord G; accessibility; anti-covering location problem; trauma center; vehicle accident.
Conflict of interest statement
The authors declare no conflict of interest.
Figures
Similar articles
-
Assessing trauma center accessibility in the Southeastern region of the U.S. to improve healthcare efficacy using an anti-covering approach.PLOS Glob Public Health. 2023 Aug 18;3(8):e0002230. doi: 10.1371/journal.pgph.0002230. eCollection 2023. PLOS Glob Public Health. 2023. PMID: 37594934 Free PMC article.
-
Targeting pediatric pedestrian injury prevention efforts: teasing the information through spatial analysis.J Trauma. 2011 Nov;71(5 Suppl 2):S511-6. doi: 10.1097/TA.0b013e31823a4b70. J Trauma. 2011. PMID: 22072037
-
Analysis of pediatric all-terrain vehicle trauma data in Middle Tennessee: implications for injury prevention.J Trauma Acute Care Surg. 2012 Oct;73(4 Suppl 3):S277-80. doi: 10.1097/TA0b013e31826b00d7. J Trauma Acute Care Surg. 2012. PMID: 23026968
-
The mortality risk from motor vehicle injuries in California has increased during the last decade.J Trauma Acute Care Surg. 2012 Sep;73(3):716-20. doi: 10.1097/TA.0b013e31825c14e2. J Trauma Acute Care Surg. 2012. PMID: 22929500
-
Cervical spine injuries in children: a review of 103 patients treated consecutively at a level 1 pediatric trauma center.J Pediatr Surg. 2001 Aug;36(8):1107-14. doi: 10.1053/jpsu.2001.25665. J Pediatr Surg. 2001. PMID: 11479837 Review.
Cited by
-
Assessing trauma center accessibility in the Southeastern region of the U.S. to improve healthcare efficacy using an anti-covering approach.PLOS Glob Public Health. 2023 Aug 18;3(8):e0002230. doi: 10.1371/journal.pgph.0002230. eCollection 2023. PLOS Glob Public Health. 2023. PMID: 37594934 Free PMC article.
References
Publication types
MeSH terms
LinkOut - more resources
Full Text Sources
Medical
Miscellaneous
