

On the Supervision of a Saturated SIR Epidemic Model with Four Joint Control Actions for a Drastic Reduction in the Infection and the Susceptibility through Time
- PMID: 35162533
- PMCID: PMC8834814
- DOI: 10.3390/ijerph19031512
On the Supervision of a Saturated SIR Epidemic Model with Four Joint Control Actions for a Drastic Reduction in the Infection and the Susceptibility through Time
Abstract
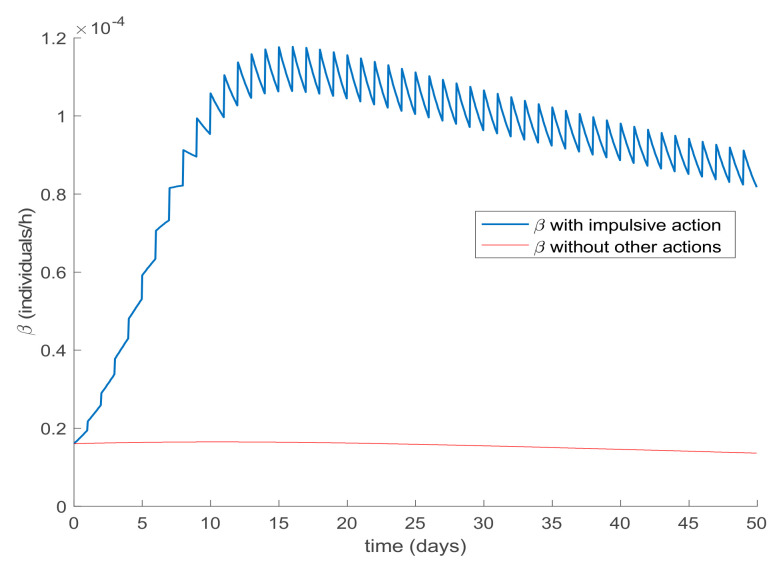
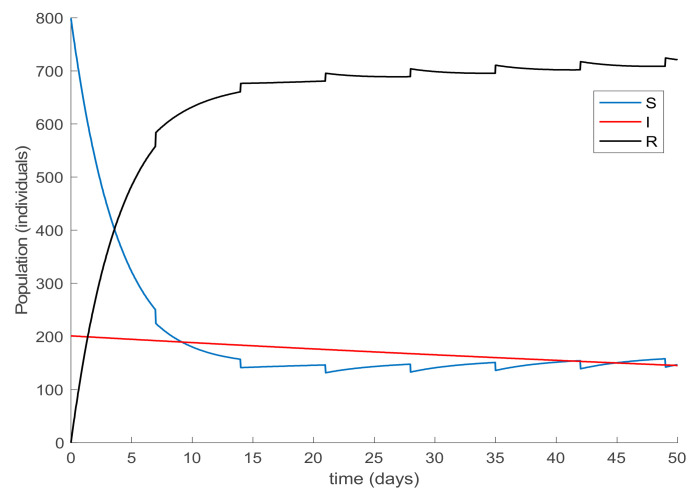
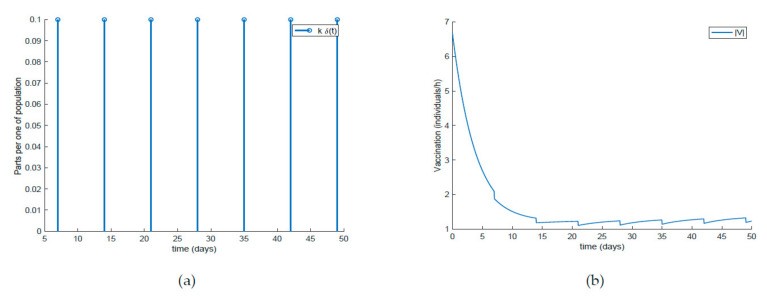
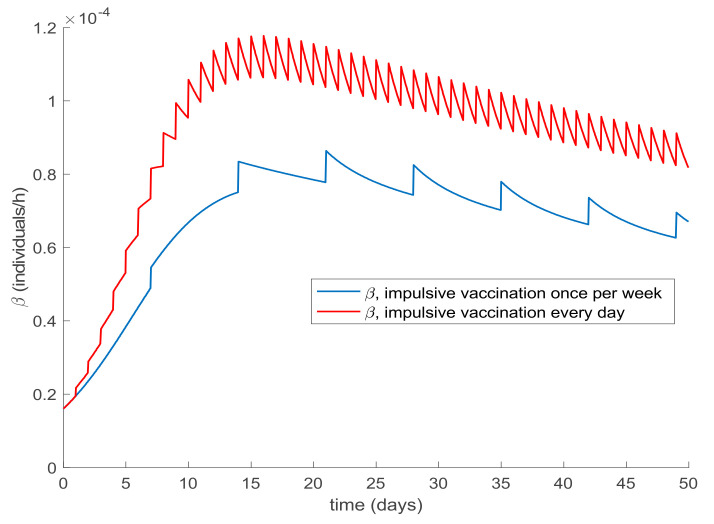
This paper presents and studies a new epidemic SIR (Susceptible-Infectious-Recovered) model with susceptible recruitment and eventual joint vaccination efforts for both newborn and susceptible individuals. Furthermore, saturation effects in the infection incidence terms are eventually assumed for both the infectious and the susceptible subpopulations. The vaccination action on newborn individuals is assumed to be applied to a fraction of them while that on the susceptible general population is of linear feedback type reinforced with impulsive vaccination actions (in practice, very strong and massive vaccination controls) at certain time points, based on information on the current levels of the susceptible subpopulation. Apart from the above vaccination controls, it is also assumed that the average of contagion contacts can be controlled via intervention measures, such as confinements or isolation measures, social distance rules, use of masks, mobility constraints, etc. The main objectives of the paper are the achievement of a strictly decreasing infection for all time periods and that of the susceptible individuals over the initial period if they exceed the disease-free equilibrium value. The monitoring mechanism is the combined activation of intervention measures to reduce the contagion contacts together with the impulsive vaccination to reduce susceptibility. The susceptibility and recovery levels of the disease-free equilibrium point are suitably prefixed by the design of the regular feedback vaccination on the susceptible subpopulation.
Keywords: SIR epidemic model; contact contagion rate; environment; equilibrium points; intervention measures; saturated incidence; vaccination controls.
Conflict of interest statement
The authors declare no conflict of interest.
Figures
Similar articles
-
Analysis of SIR epidemic models with nonlinear incidence rate and treatment.Math Biosci. 2012 Jul;238(1):12-20. doi: 10.1016/j.mbs.2012.03.010. Epub 2012 Apr 9. Math Biosci. 2012. PMID: 22516532
-
Stability analysis and optimal control of an SIR epidemic model with vaccination.Biosystems. 2011 May-Jun;104(2-3):127-35. doi: 10.1016/j.biosystems.2011.02.001. Epub 2011 Feb 21. Biosystems. 2011. PMID: 21315798
-
Limits of epidemic prediction using SIR models.J Math Biol. 2022 Sep 20;85(4):36. doi: 10.1007/s00285-022-01804-5. J Math Biol. 2022. PMID: 36125562 Free PMC article.
-
How population heterogeneity in susceptibility and infectivity influences epidemic dynamics.J Theor Biol. 2014 Jun 7;350:70-80. doi: 10.1016/j.jtbi.2014.01.014. Epub 2014 Jan 17. J Theor Biol. 2014. PMID: 24444766
-
The use of mathematical models in the epidemiological study of infectious diseases and in the design of mass immunization programmes.Epidemiol Infect. 1988 Aug;101(1):1-20. doi: 10.1017/s0950268800029186. Epidemiol Infect. 1988. PMID: 3042433 Free PMC article. Review.
References
-
- Kermack W.O., McKendrick A.G. A contribution to the mathematical theory of epidemics. Proc. R. Soc. Lond. Ser. A Math. Phys. Sci. 1927;115:700–721. doi: 10.1098/rspa.1927.0118. - DOI
-
- Etxeberria-Iriondo A., De la Sen M., Alonso-Quesada S. A new epidemic model under vaccination; Proceedings of the 2019 14th IEEE Conference on Industrial Electronics and Applications (ICIEA 2019); Xi’an, China. 19–21 June 2019; pp. 2388–2392.
Publication types
MeSH terms
LinkOut - more resources
Full Text Sources
Medical
