

Indoor Pollen Concentrations of Mountain Cedar (Juniperus ashei) during Rainy Episodes in Austin, Texas
- PMID: 35162567
- PMCID: PMC8835118
- DOI: 10.3390/ijerph19031541
Indoor Pollen Concentrations of Mountain Cedar (Juniperus ashei) during Rainy Episodes in Austin, Texas
Abstract
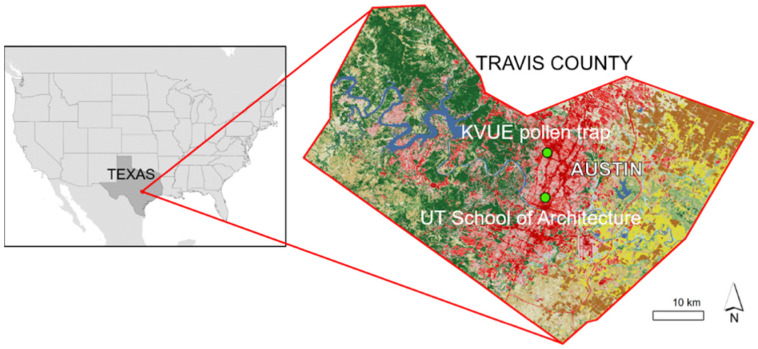
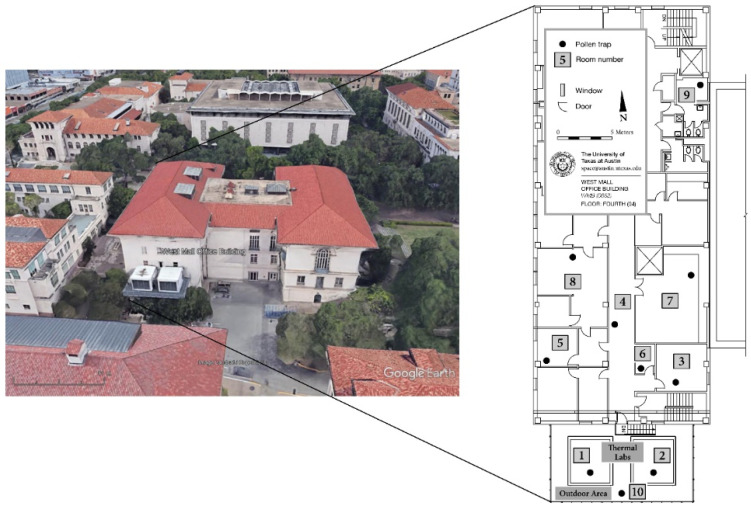
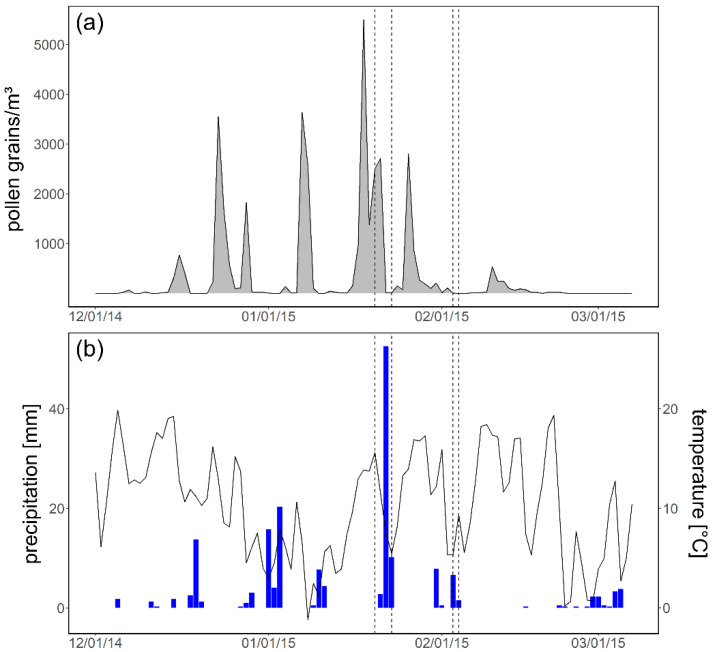
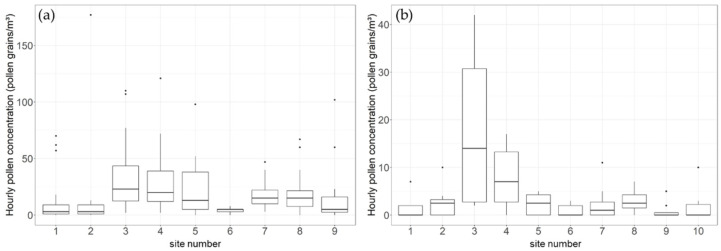
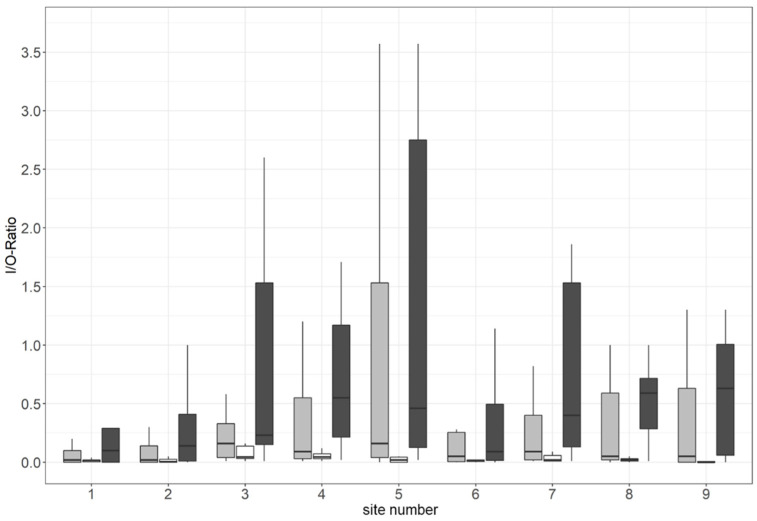
Standard pollen monitoring programs evaluate outdoor pollen concentrations; however, information on indoor pollen is crucial for human wellbeing as people spend most of the day in indoor environments. In this study, we investigated the differences in indoor mountain cedar pollen loads between rooms of different uses and with different ventilation at The University of Texas in Austin and focused on the effect of rainy episodes on indoor/outdoor ratios of pollen concentrations. Pollen were sampled outdoors and indoors, specifically in seven rooms and in two thermal labs with controlled ventilation, during the daytime on 6 days in 2015. We calculated daily pollen concentrations, campaign pollen integrals (CPIn, the sum of all daily pollen concentrations) and ratios between indoor and outdoor concentrations (I/O ratio). Pollen concentrations differed substantially based on features related to room use and ventilation: Whereas the highest CPIn was observed in a room characterized by a frequently opened window and door, the smallest CPIn was related to a storeroom without any windows and no forced ventilation. Our results showed that rainy episodes were linked to a higher mean I/O ratio (0.98; non-rainy episodes: 0.05). This suggests that pollen accumulated indoors and reached higher levels than outdoors. Low ratios seem to signal a low level of risk for allergic people when staying inside. However, under very high outdoor pollen concentrations, small ratios can still be associated with high indoor pollen levels. In turn, high I/O ratios are not necessarily related to a (very) high indoor exposure. Therefore, I/O ratios should be considered along with pollen concentration values for a proper risk assessment. Exposure may be higher in indoor environments during prevailing precipitation events and at the end of the pollen season of a specific species. Standardized indoor environments (e.g., thermal labs) should be included in pollen monitoring programs.
Keywords: indoor pollen; mountain cedar; personal volumetric air samplers; thermal labs; ventilation.
Conflict of interest statement
The authors declare no conflict of interest.
Figures
Similar articles
-
Indoor birch pollen concentrations differ with ventilation scheme, room location, and meteorological factors.Indoor Air. 2017 May;27(3):539-550. doi: 10.1111/ina.12351. Epub 2016 Nov 12. Indoor Air. 2017. PMID: 27748969
-
Relationships among indoor, outdoor, and personal airborne Japanese cedar pollen counts.PLoS One. 2015 Jun 25;10(6):e0131710. doi: 10.1371/journal.pone.0131710. eCollection 2015. PLoS One. 2015. PMID: 26110813 Free PMC article.
-
Relationship between indoor and outdoor levels of fine particle mass, particle number concentrations and black smoke under different ventilation conditions.J Expo Anal Environ Epidemiol. 2004 Jul;14(4):275-83. doi: 10.1038/sj.jea.7500317. J Expo Anal Environ Epidemiol. 2004. PMID: 15254474
-
Human exposure to NO2 in school and office indoor environments.Environ Int. 2019 Sep;130:104887. doi: 10.1016/j.envint.2019.05.081. Epub 2019 Jun 10. Environ Int. 2019. PMID: 31195224 Review.
-
Human exposure to ozone in school and office indoor environments.Environ Int. 2018 Oct;119:503-514. doi: 10.1016/j.envint.2018.07.012. Epub 2018 Jul 24. Environ Int. 2018. PMID: 30053738 Review.
References
-
- Pawankar R., Canonica G.W., Holgate S.T., Lockey R.F., Blaiss M.S. World Allergy Organization (WAO) White Book on Allergy: Update 2013: Resource Document. World Allergy Organization. 2013. [(accessed on 9 September 2020)]. Available online: https://www.worldallergy.org/UserFiles/file/WhiteBook2-2013-v8.pdf.
-
- Asthma and Allergy Foundation of sAmerica Allergy Capitals. The Most Challenging Places to Live with Allergies. [(accessed on 14 November 2021)]. Report February 2021. Available online: https://www.aafa.org/media/2933/aafa-2021-allergy-capitals-report.pdf.
-
- Bunderson L.D., van de Water P., Levetin E. Predicting and quantifying pollen production in Juniperus ashei forests. Phytologia. 2012;94:417–438.
-
- Levetin E., Bunderson L., van de Water P., Luvall J.C. Aerobiology of Juniperus ashei pollen in Texas and Oklahoma. J. Allergy Clin. Immunol. 2011;127:AB170. doi: 10.1016/j.jaci.2010.12.674. - DOI
Publication types
MeSH terms
Substances
LinkOut - more resources
Full Text Sources
Medical
