. 2022 Jan 19;23(3):1065.
doi: 10.3390/ijms23031065.

Identification and Allele Combination Analysis of Rice Grain Shape-Related Genes by Genome-Wide Association Study

Affiliations

Identification and Allele Combination Analysis of Rice Grain Shape-Related Genes by Genome-Wide Association Study

Bingxin Meng et al. Int J Mol Sci. .

Abstract

Grain shape is an important agronomic character of rice, which affects the appearance, processing, and the edible quality. Screening and identifying more new genes associated with grain shape is beneficial to further understanding the genetic basis of grain shape and provides more gene resources for genetic breeding. This study has a natural population containing 623 indica rice cultivars. Genome-wide association studies/GWAS of several traits related to grain shape (grain length/GL, grain width/GW, grain length to width ratio/GLWR, grain circumferences/GC, and grain size/grain area/GS) were conducted by combining phenotypic data from four environments and the second-generation resequencing data, which have identified 39 important Quantitative trait locus/QTLs. We analyzed the 39 QTLs using three methods: gene-based association analysis, haplotype analysis, and functional annotation and identified three cloned genes (GS3, GW5, OsDER1) and seven new candidate genes in the candidate interval. At the same time, to effectively utilize the genes in the grain shape-related gene bank, we have also analyzed the allelic combinations of the three cloned genes. Finally, the extreme allele combination corresponding to each trait was found through statistical analysis. This study's novel candidate genes and allele combinations will provide a valuable reference for future breeding work.

Keywords: GWAS; allele combination analysis; gene-based association analysis; grain shape; haplotype analysis.


Conflict of interest statement

The authors declare no conflict of interest.

Figures
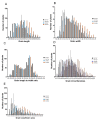
Figure 1
Figure 1
The phenotypic distribution. Phenotypic distribution of five-grain shape traits: (A) grain length/GL, (B) grain width/GW, (C) grain length to width ratio/GLWR, (D) grain circumferences/GC, and (E) grain size/grain area/GS) in 2017EZ, 2017GA, 2018EZ, and 2018GA. Gongan/GA, Ezhou/EZ.
Figure 2
Figure 2
Phenotypic correlation matrix. Grain length/GL, grain width/GW, grain length to width ratio/GLWR, grain size/grain area/GS, grain circumferences/GC. The areas of ellipses showed the absolute value of corresponding correlation coefficients (r) (upper triangular). Right and left oblique ellipses and colors indicated positive and negative correlations, respectively. The values were corresponding r between the traits (lower triangular).
Figure 3
Figure 3
Graphic dispersion of scores in relation to axes representing the canonical variables for five traits related to grain shape (GL, GW, GLWR, GC, GS). Cluster I, cluster II, and cluster III are groups based on Mahalanobis distance between samples. Different colors represent different groups.
Figure 4
Figure 4
Population Structure, Kinship, and LD decay plot. (A) PCA plot for the 623 varieties. PC1 and PC2 indicate the score of principal components 1 and 2, respectively. Different colors represent different principal component score groups. (B) Heat map of kinship from R Package “pheatmap” shows the tree on the top and left. (C) LD decay. Y-axis was the average r2 value of each 5 kb region, and X-axis was the physical distance between markers.
Figure 5
Figure 5
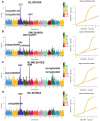
Manhattan plot and Q-Q plot. (A) 2018 GA’s GL Manhattan and Q-Q images. (B) 2018 GA’s GW Manhattan and Q-Q images. (C) 2017 EZ’s GLWR Manhattan and Q-Q images. (D) 2018 GA’s GC Manhattan and Q-Q images. The red arrow indicates the location of the gene. In the upper right corner is the SNP density indicator band, and different colors represent different SNP distribution densities. Gongan/GA, Ezhou/EZ.
Figure 6
Figure 6
Haplotype box plot. (AD) For grain length, haplotype box plot of (A) GS3, (B) GW5, (C) Os02g0805100 and (D) Os02g0805400. (EI) For grain width, haplotype box plot of (E) GS3, (F) GW5, (G) OsDER1, (H) Os02g0164600, and (I) Os04g0101400. (JN) For grain length to width ratio, haplotype box plot of (J) GS3, (K) GW5, (L) Os01g0589900, (M) Os10g0344500 and (N) Os10g0344900. (O,P) For grain circumferences, haplotype box plots of (O) GS3 and (P) Os02g0805100. The letter (a, b, and c) suggested significance of ANOVA (for ≥three haplotypes) or t-test (for two haplotypes) at p < 0.01. The value on the box was the number of individuals of each haplotype. X-axis coordinates are the corresponding significant SNPs. Gongan/GA, Ezhou/EZ.
Figure 7
Figure 7
Gene structure, Significant SNP locus, and alleles. (A) GS3, Hap A (AATCT), Hap B (TGCTG) and Hap C (WRYYK). (B) GW5, Hap A (CG), Hap B (TA), Hap C (TG) and Hap D (YR). (C) OsDER1, Hap A (T), Hap B (C) and Hap C (Y). The red arrow indicates the location of the start codon “ATG”. The number after “ATG” is its position on the chromosome. The number on the significant SNP is its position relative to “ATG”.
Figure 8
Figure 8
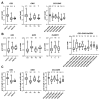
Box plot of alleles and allelic combinations. (A) grain length/GL, (B) grain width/GW, (C) grain length to width ratio/GLWR. The letter (a, b, and c) suggested significance of ANOVA at p < 0.01. The value on the box was the number of individuals of each allele. X-axis coordinates are the corresponding significant SNPs.

Similar articles

Cited by

References

    1. Sakamoto T., Matsuoka M. Identifying and exploiting grain yield genes in rice. Curr. Opin. Plant Biol. 2008;11:209–214. doi: 10.1016/j.pbi.2008.01.009. - DOI - PubMed
    1. Tan Y.F., Xing Y.Z., Li J.X., Yu S.B., Xu C.G., Zhang Q. Genetic bases of appearance quality of rice grains in Shanyou 63, an elite rice hybrid. Theor. Appl. Genet. 2000;101:823–829. doi: 10.1007/s001220051549. - DOI - PubMed
    1. Redoña E.D., Mackill D.J. Quantitative trait locus analysis for rice panicle and grain characteristics. Theor. Appl. Genet. 1998;96:957–963. doi: 10.1007/s001220050826. - DOI
    1. Li Z., Tang L., Qiu J., Zhang W., Wang Y., Tong X., Wei X., Hou Y., Zhang J. Serine carboxypeptidase 46 Regulates Grain Filling and Seed Germination in Rice (Oryza sativa L.) PLoS ONE. 2016;11:e0159737. doi: 10.1371/journal.pone.0159737. - DOI - PMC - PubMed
    1. Liu J., Chen J., Zheng X., Wu F., Lin Q., Heng Y., Tian P., Cheng Z., Yu X., Zhou K., et al. GW5 acts in the brassinosteroid signalling pathway to regulate grain width and weight in rice. Nat. Plants. 2017;3:17043. doi: 10.1038/nplants.2017.43. - DOI - PubMed

LinkOut - more resources