. 2022 Jan 19;23(3):1079.
doi: 10.3390/ijms23031079.

Kynurenic Acid and Its Analog SZR104 Exhibit Strong Antiinflammatory Effects and Alter the Intracellular Distribution and Methylation Patterns of H3 Histones in Immunochallenged Microglia-Enriched Cultures of Newborn Rat Brains

Affiliations

Kynurenic Acid and Its Analog SZR104 Exhibit Strong Antiinflammatory Effects and Alter the Intracellular Distribution and Methylation Patterns of H3 Histones in Immunochallenged Microglia-Enriched Cultures of Newborn Rat Brains

Melinda Szabo et al. Int J Mol Sci. .

Abstract

Kynurenic acid (KYNA) is implicated in antiinflammatory processes in the brain through several cellular and molecular targets, among which microglia-related mechanisms are of paramount importance. In this study, we describe the effects of KYNA and one of its analogs, the brain-penetrable SZR104 (N-(2-(dimethylamino)ethyl)-3-(morpholinomethyl)-4-hydroxyquinoline-2-carboxamide), on the intracellular distribution and methylation patterns of histone H3 in immunochallenged microglia cultures. Microglia-enriched secondary cultures made from newborn rat forebrains were immunochallenged with lipopolysaccharide (LPS). The protein levels of selected inflammatory markers C-X-C motif chemokine ligand 10 (CXCL10) and C-C motif chemokine receptor 1 (CCR1), histone H3, and posttranslational modifications of histone H3 lys methylation sites (H3K9me3 and H3K36me2, marks typically associated with opposite effects on gene expression) were analyzed using quantitative fluorescent immunocytochemistry and western blots in control or LPS-treated cultures with or without KYNA or SZR104. KYNA and SZR104 reduced levels of the inflammatory marker proteins CXCL10 and CCR1 after LPS-treatment. Moreover, KYNA and SZR104 favorably affected histone methylation patterns as H3K9me3 and H3K36me2 immunoreactivities, and histone H3 protein levels returned toward control values after LPS treatment. The cytoplasmic translocation of H3K9me3 from the nucleus indicated inflammatory distress, a process that could be inhibited by KYNA and SZR104. Thus, KYNA signaling and metabolism, and especially brain-penetrable KYNA analogs such as SZR104, could be key targets in the pathway that connects chromatin structure and epigenetic mechanisms with functional consequences that affect neuroinflammation and perhaps neurodegeneration.

Keywords: CCR1; CXCL10; H3K36me2; H3K9me3; SZR104; antiinflammation; cytoplasmic histone; kynurenic acid.


Conflict of interest statement

The authors declare no conflict of interest. The funders had no role in the design of the study; in the collection, analyses, or interpretation of data; in the writing of the manuscript; or in the decision to publish the results.

Figures
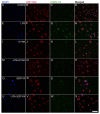
Figure 1
Figure 1
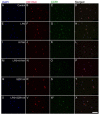
Localization of CXCL10 immunoreactivity in CD11b/c-labeled microglial cells in unchallenged and treated microglia-enriched cultures. The distribution of CD11b/c (red) and CXCL10 (green) immunoreactivities and their colocalizations is shown. The anti-CD11b/c antibody was used to highlight microglial cells. Note the very high purity of the microglial cultures (DAPI vs. CD11b/c labels). The following cultures (subDIV7) were used: (AD) unstimulated (control), (EH) LPS-challenged, (IL) KYNA-treated, (MP) LPS + KYNA-treated, (QT) SZR104-treated, and (UX) LPS + SZR104-treated cultures. Cell nuclei are labeled with DAPI (blue). CXCL10 immunoreactivity was more intensive after LPS treatment in microglia; KYNA and SZR104 decreased the amount of CXCL10 in these cells. No visible cell loss was observed after the treatments were applied. This is in agreement with the findings of Steiner et al. [43], who found there was no effect on cell viability when microglial cells were treated with KYNA. LPS: 20 ng/mL; KYNA: 1 µM; and SZR104: 1 µM. Scale bar: 75 µm.
Figure 2
Figure 2
Quantitative light microscopic microdensitometric analysis of CXCL10 protein expression in unchallenged and treated microglia-enriched cultures. The LPS challenge significantly elevated cytoplasmic CXCL10 immunoreactivity (approximately fourfold) in microglial cells, whereas KYNA alone, SZR104 alone, or the combined treatments significantly weakened the CXCL10 immunoreactive signal to levels observed in unchallenged (control) cells. LPS: 20 ng/mL; KYNA: 1 µM; and SZR104: 1 µM. Data (presented as means ± SEMs) were analyzed using Kruskal–Wallis one-way ANOVA on ranks: * p < 0.05.
Figure 3
Figure 3
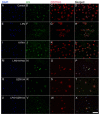
Localization of CCR1 immunoreactivity in CD11b/c-labeled microglial cells in unchallenged and treated microglia-enriched cultures. The distribution of CD11b/c (red) and CCR1 (green) immunoreactivities, as well as their colocalizations, is shown. The anti-CD11b/c antibody was used to highlight microglial cells. Note the very high purity of the microglial cultures (DAPI vs. CD11b/c labels). The following cultures (subDIV7) were used: (AD) unstimulated (control), (EH) LPS-challenged, (IL) KYNA-treated, (MP) LPS + KYNA-treated, (QT) SZR104-treated, and (UX) LPS + SZR104-treated cultures. Representative immunocytochemical images confirm that the LPS challenge (G) slightly increased CCR1 immunoreactivity in microglial cells compared with that in unchallenged (control) cells (C), but the level of the immunoreactive signal returned to control levels with KYNA (K), SZR104 (S), or combined treatments (O,W). LPS: 20 ng/mL; KYNA: 1 µM; and SZR104: 1 µM. Scale bar: 75 µm.
Figure 4
Figure 4
Quantitative analysis of CCR1 protein expression in unchallenged and treated microglia-enriched cultures. (A) A quantitative light microscopic microdensitometric analysis of CCR1 protein expression. The LPS challenge significantly elevated CCR1 immunoreactivity to approximately 148% of the control value in microglial cells, whereas KYNA or SZR104 alone, or the combined treatment of LPS + KYNA, did not significantly alter the amount of CCR1 immunoreactive signal compared to controls. However, LPS + SZR104-treated cultures displayed significantly lowered CCR1 levels compared to LPS-treated cultures, and they returned to levels seen in unchallenged (control) cells. Data (presented as means ± SEMs) were analyzed with the Mann–Whitney rank sum test: * p < 0.05. (B) A quantitative western blot analysis of cytoplasmic CCR1 immunoreactivity. Representative images of western blots are shown below the graph, together with the GAPDH immunoreactive bands that served as protein load control. Protein samples were collected from at least five separate cultures, electrophoresed, and then quantitatively analyzed, as described in the Materials and Methods section. CCR1 immunoreactivity significantly increased after the LPS treatment. It did not change when the cultures were treated with LPS + KYNA or LPS + SZR104. Error bars indicate integrated optical density values with the data values for each group expressed as a percentage of the control values. LPS: 20 ng/mL; KYNA: 1 µM; and SZR104: 1 µM. Integrated optical density data (presented as means ± SEMs) were analyzed with the Mann–Whitney rank sum test: * p < 0.02.
Figure 5
Figure 5
Localization of histone H3 protein immunoreactivity in unchallenged and treated microglia-enriched cultures. Representative immunocytochemical images demonstrate the intracellular distribution of histone H3 protein immunopositivity (green) in unstimulated (control) (AD), LPS-challenged (EH), KYNA-treated (IL), LPS + KYNA-treated (MP), SZR104-treated (QT), and LPS + SZR104-treated (UX) CD11b/c-immunopositive microglial cells (red). The anti-CD11b/c antibody was used to highlight microglial cells. Note the very high purity of the microglial cultures (DAPI vs. CD11b/c labels). Histone H3 was detected in both the nucleus and cytoplasm of microglia. Cell nuclei are labeled with DAPI (blue). LPS: 20 ng/mL; KYNA: 1 µM; and SZR104: 1 µM. Scale bar: 75 µm.
Figure 6
Figure 6
Intracellular localization of histone H3 protein immunoreactivity in unchallenged and treated microglia-enriched cultures. Representative enlarged immunocytochemical images showing a subset of microgllial cells from Figure 5 demonstrate the intracellular distribution of histone H3 immunopositivity (green) in unstimulated (control) (AD), LPS-challenged (EH), and LPS + SZR104-treated (IL) CD11b/c-immunopositive microglial cells (red). The anti-CD11b/c antibody was used to highlight microglial cells. After LPS treatment (F), unmodified histone H3 was detected in both the nucleus and cytoplasm of microglia. LPS + SZR104 treatments lowered both nuclear and cytoplasmic H3 immunosignal. Cell nuclei are labeled with DAPI (blue). Scale bar: 15 µm.
Figure 7
Figure 7
Intracellular distribution of unmodified histone H3 protein immunoreactivity in the nucleus and cytoplasm of microglia in unchallenged and treated microglia-enriched cultures. Corrected total cell fluorescence (CTCF) values for the whole cell, nucleus, and cytoplasm were calculated as described in the Materials and Methods section. (A) The amount of H3 immunoreactivity rose significantly in the nucleus of LPS- and KYNA-treated microglia. SZR104 effectively decreased the amount of histone H3 after LPS treatment. (B) Except for the LPS + SZR104 treatment, all the treatments increased the amount of unmodified cytoplasmic histone H3. LPS: 20 ng/mL; KYNA: 1 µM; and SZR104: 1 µM. Data (presented as means ± SEMs) were analyzed with Kruskal–Wallis one-way ANOVA on ranks: * p < 0.05.
Figure 8
Figure 8
Quantitative western blot analysis of the cytoplasmic histone H3 protein level in microglia-enriched cultures. Representative images of western blots are shown below the graph, together with the GAPDH immunoreactive bands that served as inner standards. Protein samples were collected from at least five separate cultures (subDIV7), electrophoresed, and quantitatively analyzed as described in the Materials and Methods section. The combined LPS + KYNA treatment induced a significant increase in histone H3 immunoreactivity when compared with that in control (unchallenged) and other treated cultures. The error bars indicate integrated optical density values with data expressed as a percentage of the control values. LPS: 20 ng/mL; KYNA: 1 µM; and SZR104: 1 µM. Data values (presented as means ± SEMs) were analyzed using ANOVA followed by pairwise multiple comparisons (Holm–Sidak method): * p < 0.05.
Figure 9
Figure 9
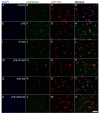
Localization of H3K9me3 immunoreactivity in CD11b/c-labeled microglia in unchallenged and treated microglia-enriched cultures. Representative immunocytochemical images showing the intracellular distribution of histone H3K9me3 protein immunopositivity (green) in unstimulated (control) (AD), LPS-challenged (EH), KYNA-treated (IL), LPS + KYNA-treated (MP), SZR104-treated (QT), and LPS + SZR104-treated (UX) CD11b/c-immunopositive microglial cells (red). The anti-CD11b/c antibody was used to highlight microglial cells. The very high purity of the microglial cultures is evident (DAPI vs. CD11b/c labels). Note that LPS challenge (F) increased the H3K9me3 immunopositivity relative to that in unchallenged controls (B) or other treatments. Histone H3K9me3 was detected in both the nucleus and cytoplasm. LPS: 20 ng/mL; KYNA: 1 µM; and SZR104: 1 µM. Scale bar: 75 µm.
Figure 10
Figure 10
Intracellular localization of H3K9me3 immunoreactivity in CD11b/c-labeled microglia in unchallenged and treated microglia-enriched cultures. Representative enlarged immunocytochemical images showing a subset of microgllial cells from Figure 9 demonstrate the intracellular distribution of histone H3K9me3 immunopositivity (green) in unstimulated (control) (AD), LPS-challenged (EH), and LPS + SZR104-treated (IL) CD11b/c-immunopositive microglial cells (red). The anti-CD11b/c antibody was used to highlight microglial cells. After LPS treatment (F), increased amounts of H3K9me3 immunolabel were detected in both the nucleus and cytoplasm of microglia, although the nuclear component was more pronounced. LPS + SZR104 treatments lowered the amounts of both nuclear and cytoplasmic H3K9me3 immunosignal. Cell nuclei are labeled with DAPI (blue). Scale bar: 15 µm.
Figure 11
Figure 11
Intracellular distribution of histone H3K9me3 protein immunoreactivity in the nucleus and cytoplasm of microglia in unchallenged and treated microglia-enriched cultures. A quantitative microdensitometric analysis of H3K9me3-immunopositive signals in the nucleus (A) and cytoplasm (B) was performed, as described in the Materials and Methods section. (A) LPS treatment increased the amount of H3K9me3 signal in the nucleus, whereas KYNA and SZR104 treatment did not alter the signal compared to the control level. (B) Cytoplasmic H3K9me3 was reduced uniformly when cells were treated with KYNA, SZR104, or with a combination of treatments. LPS: 20 ng/mL; KYNA: 1 µM; and SZR104: 1 µM. Integrated density data values (presented as means ± SEMs) were analyzed with Kruskal–Wallis one-way ANOVA: * p < 0.05.
Figure 12
Figure 12
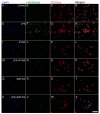
Localization of H3K36me2 immunoreactivity in CD11b/c-labeled microglia in unchallenged and treated microglia-enriched cultures. Representative immunocytochemical images showing the intracellular distribution of histone H3K36me2 protein immunopositivity (green) in unstimulated (control) (AD), LPS-challenged (EH), KYNA-treated (IL), LPS + KYNA-treated (MP), SZR104-treated (QT), and LPS + SZR104-treated (UX) CD11b/c-immunopositive microglial cells (red). The anti-CD11b/c antibody was used to highlight microglial cells. The very high purity of the microglial cultures is evident (DAPI vs. CD11b/c labels). Note that the LPS challenge (EH) markedly increased H3K36me2 immunopositivity relative to that of the unchallenged control (AD) or any other treatment (IX). Histone H3K36me2 was detected in the nucleus. LPS: 20 ng/mL; KYNA: 1 µM; and SZR104: 1 µM. Scale bar: 75 µm.
Figure 13
Figure 13
Intracellular localization of H3K36me2 immunoreactivity in CD11b/c-labeled microglia in unchallenged and treated microglia-enriched cultures. Representative enlarged immunocytochemical images showing a subset of microgllial cells from Figure 12 demonstrate the intracellular distribution of histone H3K36me2 immunopositivity (green) in unstimulated (control) (AD), LPS-challenged (EH), and LPS + SZR104-treated (IL) CD11b/c-immunopositive microglial cells (red). The anti-CD11b/c antibody was used to highlight microglial cells. After LPS treatment (F), increased amounts of H3K36me2 immunolabel were detected in the nucleus of microglia. There was no signal in the cytoplasm. LPS + SZR104 treatments lowered the amounts of nuclear H3K36me2 immunosignal (J). Cell nuclei are labeled with DAPI (blue). Scale bar: 15 µm.
Figure 14
Figure 14
Intracellular distribution of histone H3K36me2 protein immunoreactivity in the nucleus of microglia in unchallenged and treated microglia-enriched cultures. A quantitative microdensitometric analysis of H3K36me2-immunopositive signals in the nucleus was performed as described in the Materials and Methods section. The LPS treatment dramatically increased the amount of the H3K36me2 signal in the nucleus, whereas KYNA, SZR104, or a combination of treatments decreased it toward the unchallenged control levels. LPS: 20 ng/mL; KYNA: 1 µM; and SZR104: 1 µM. The integrated density data values (presented as means ± SEMs) were analyzed with Kruskal–Wallis one-way ANOVA on ranks: * p < 0.05.

Similar articles

Cited by

References

    1. Vazirinejad R., Ahmadi Z., Kazemi Arababadi M., Hassanshahi G., Kennedy D. The biological functions, structure and sources of CXCL10 and its outstanding part in the pathophysiology of multiple sclerosis. Neuroimmunomodulation. 2014;21:322–330. doi: 10.1159/000357780. - DOI - PubMed
    1. Vécsei L., Szalárdy L., Fülöp F., Toldi J. Kynurenines in the CNS: Recent advances and new questions. Nat. Rev. Drug Discov. 2013;12:64–82. doi: 10.1038/nrd3793. - DOI - PubMed
    1. Wirthgen E., Hoeflich A., Rebl A., Günther J. Kynurenic acid: The janus-faced role of an immunomodulatory tryptophan metabolite and its link to pathological conditions. Front. Immunol. 2017;8:1957. doi: 10.3389/fimmu.2017.01957. - DOI - PMC - PubMed
    1. Routy J.P., Routy B., Graziani G.M., Mehraj V. The kynurenine pathway is a double-edged sword in immune-privileged sites and in cancer: Implications for immunotherapy. Int. J. Tryptophan Res. 2016;9:67–77. doi: 10.4137/IJTR.S38355. - DOI - PMC - PubMed
    1. Lajkó N., Kata D., Szabó M., Mátyás A., Dulka K., Földesi I., Fülöp F., Gulya K., Vécsei L., Mihály A. Sensitivity of rodent microglia to kynurenines in models of epilepsy and inflammation in vivo and in vitro: Microglia activation is inhibited by kynurenic acid and the synthetic analogue SZR104. Int. J. Mol. Sci. 2020;21:9333. doi: 10.3390/ijms21239333. - DOI - PMC - PubMed

MeSH terms

LinkOut - more resources