. 2022 Jan 20;23(3):1116.
doi: 10.3390/ijms23031116.

Sesquiterpene Lactones Potentiate Olaparib-Induced DNA Damage in p53 Wildtype Cancer Cells

Affiliations

Sesquiterpene Lactones Potentiate Olaparib-Induced DNA Damage in p53 Wildtype Cancer Cells

Hugh C Osborne et al. Int J Mol Sci. .

Abstract

Despite notable advances in utilising PARP inhibitor monotherapy, many cancers are not PARP inhibitor-sensitive or develop treatment resistance. In this work, we show that the two structurally-related sesquiterpene lactones, a 2-bromobenzyloxy derivative of dehydrosantonin (BdS) and alantolactone (ATL) sensitise p53 wildtype, homologous recombination-proficient cancer cells to low-dose treatment with the PARP inhibitor, olaparib. Exposure to combination treatments of olaparib with BdS or ATL induces cell-cycle changes, chromosomal instability, as well as considerable increases in nuclear area. Mechanistically, we uncover that mitotic errors likely depend on oxidative stress elicited by the electrophilic lactone warheads and olaparib-mediated PARP-trapping, culminating in replication stress. Combination treatments exhibit moderately synergistic effects on cell survival, probably attenuated by a p53-mediated, protective cell-cycle arrest in the G2 cell-cycle phase. Indeed, using a WEE1 inhibitor, AZD1775, to inhibit the G2/M cell-cycle checkpoint further decreased cell survival. Around half of all cancers diagnosed retain p53 functionality, and this proportion could be expected to increase with improved diagnostic approaches in the clinic. Utilising sublethal oxidative stress to sensitise p53 wildtype, homologous recombination-proficient cancer cells to low-dose PARP-trapping could therefore serve as the basis for future research into the treatment of cancers currently refractory to PARP inhibition.

Keywords: 2-bromobenzyloxy derivative of dehydrosantonin (BdS); DNA replication stress; PARP inhibitor (PARPi); alantolactone (ATL); cancer; olaparib; reactive oxygen species (ROS); sesquiterpene lactones.


Conflict of interest statement

The authors declare no conflict of interest.

Figures

Figure 1
Figure 1
Effects of the sesquiterpene lactone, BdS, on UBE2D activity in vitro and in cells. (A) COBALT Alignment and ESPript visualisation of UniProt sequences of UBE2D1-4 [15,16]. Red shading of single-letter amino acid codes indicates homology; white shading shows points of differentiation between enzymes. Red arrow points out catalytic cysteine, C85. Secondary structure elements are displayed at the top for UBE2D1. UBE2D1 accessibility is indicated at the bottom (colour gradient—darker blue to white showing decreasing accessibility). (B) Overlay of available UBE2D crystal structures (UBE2D1: PDB 5TUT (red), UBE2D2: PDB 2ESK (green), UBE2D3: PDB 3L1Z (blue)) [17,18,19]. Red arrow indicates catalytic cysteine. (C) Chemical structures of sesquiterpene lactones, ATL and IJ-5 (alantolactone, and 1β-hydroxyalantolactone, respectively), and BdS showing their shared covalent-binding warhead in blue. (D) Left: In vitro ubiquitylation assay workflow (created using Biorender). Right: Representative blots showing the effects of BdS on ubiquitin-loading for UBE2D1 (n = 2 independent experiments) and UBE2D3 (n = 3 independent experiments). (E) Doxycycline (Dox) induction of GFP-UBE2D1 wt (wild-type) and GFP-UBE2D1 CD (catalytically dead—C85S; n = 1 experiment) in U2OS cells. (F) Fluorescence images of GFP-UBE2D1 wt and GFP-UBE2D1 CD in siCTRL or siALL-Ds depleted U2OS cells, after doxycycline (Dox) induction or not. Nuclei are outlined in white using DAPI as a reference (scale bar – 20 μm). (G) GFP-Trap pulldowns of GFP-UBE2D1 stably expressed in U2OS cells. IP represents 1% of the input (n = 2 independent experiments). Immunoblot sections are derived from same membrane. (H) siALL-Ds depletion efficiency of endogenous (endo.) UBE2D1 (D1) in U2OS cells stably expressing GFP. Blot is representative of n = 4 independent experiments. (I) Effects of PYR-41 (left), a ubiquitin E1 (UBA1) inhibitor, and BdS (right) on GFP-UBE2D1 wt auto-ubiquitylation at the indicated concentrations and treatment times (n = 1 for PYR-41; n = 2 independent experiments for BdS). Normalised blot band intensity quantification was performed using ImageJ.
Figure 2
Figure 2
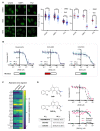
Effects of BdS on DNA repair and cell growth. (A) Left: Representative images of U2OS cells treated with BdS, BTZ, or vehicle only (DMSO). Nuclei are outlined in white using DAPI as a reference (scale bar—20 μm). Right: Quantification of foci number per cell for DNA damage response (DDR) factors (γH2AX, 53BP1, FK2; Alexa Fluor 488). For BdS: each dataset represents a minimum of 3000 U2OS cells (3 replicates; n = 126). For bortezomib (BTZ): each dataset represents a minimum of 3000 U2OS cells (2 independent experiments; n = 36). Data points correspond to each recorded field (mean ± SEM). (B) Non-linear regression curve analyses of normalised growth curves of Kuramochi (n = 3 independent experiments), OVCAR3 (n = 3 independent experiments), and COV318 (n = 2 independent experiments) cells in the presence of BdS or vehicle only (DMSO) ± irradiation (2 Gγ) across 136 h. Homologous recombination (HR) status of the cells is indicated below (red—deficient, green—proficient) [32,33]. (C) Heat map demonstrating differences in gene expression across the indicated cell lines from published data (CCLE) for key replication stress-related genes [34]. (D) Top left: comparison of chemical structures of BdS and its inactive analogue, BdS-H2 (differing moiety in blue). Bottom left: IC50 values calculated from non-linear regression curves shown in (B). Values are provided in μM (95% confidence intervals). Top right: Overlay of regression curves shown in (B) for non-irradiated samples across the three high-grade serous ovarian carcinoma (HGSOC) cell lines, following treatment with BdS. Bottom right: Overlay of regression curves for non-irradiated samples following treatment with BdS-H2. Statistical significance indicated as follows: n.s.—p > 0.05, and ****—p < 0.0001.
Figure 3
Figure 3
BdS and alantolactone (ATL) potentiate olaparib-mediated DNA damage and replication stress-related RPA consumption. (A) Quantification (top) and representative images (bottom) of normalised nuclear γH2AX immunofluorescence intensity (Alexa Fluor 488; AF488) of ≥20,000 U2OS cells (≥3 independent experiments; n ≥ 504) following 24 h treatment with olaparib, BdS and/or ATL as indicated, compared to vehicle only (DMSO). Data points correspond to each recorded field (mean ± SEM). DMSO and olaparib control datasets are identical due to forming part of the same experimental pipeline. Scale bar—50 μm. (B) Quantification (top) and representative images (bottom) of induced RPA1 foci per cell (Alexa Fluor 488; AF488) of ≥9000 U2OS cells (≥3 replicates; n ≥ 168) after 24 h treatment with olaparib, BdS, and/or ATL as indicated, compared to vehicle only (DMSO). Data points relate to each recorded field (mean ± SEM). DMSO and olaparib control datasets are identical due to forming part of the same experimental pipeline. Nuclei are outlined in white using DAPI as a reference. Scale bar—20 μm. Statistical significance indicated as follows: n.s.—p > 0.05, *—p < 0.05, ***—p < 0.001, and ****—p < 0.0001.
Figure 4
Figure 4
Cooperative effects of BdS and alantolactone (ATL) with olaparib depend on oxidative stress, PARP-trapping, and covalent binding capacity. (A) Quantification (left) and representative images (right) of normalised nuclear γH2AX immunofluorescence intensity (Alexa Fluor 488) of ≥ 7500 U2OS cells (3 replicates; n = 168) following 24 h treatment with olaparib, BdS, and/or ATL as indicated, compared to vehicle only (DMSO) after N-acetylcysteine (N-AC) pre-treatment (10 mM, 1 h). Data points relate to each recorded field (mean ± SEM). Scale bar—50 μm. (B) Quantification (left) and representative images (right) of normalised nuclear γH2AX immunofluorescence intensity (Alexa Fluor 488) of ≥ 7500 U2OS cells (3 replicates; n = 168) following 24 h treatment with veliparib, BdS, and/or ATL as indicated, compared to vehicle only (DMSO). Data points relate to each recorded field (mean ± SEM). Scale bar—50 μm. (C) Quantification (left) and representative images (right) of normalised nuclear γH2AX immunofluorescence intensity (Alexa Fluor 488) of ≥ 7500 U2OS cells (3 replicates; n = 168) following 24 h treatment with olaparib and/or BdS-H2 as indicated, compared to vehicle only (DMSO). Data points relate to each recorded field (mean ± SEM). Scale bar—50 μm. (D) Quantification (left) and representative images (right) of induced RPA1 foci per cell (Alexa Fluor 488) of ≥ 18,000 U2OS cells (2 independent experiments; n = 336) following 24 h treatment with olaparib and/or BdS-H2 as indicated, compared to vehicle only (DMSO). Data points relate to each recorded field (mean ± SEM). DMSO and olaparib controls are identical to the ones displayed in Figure 3B due to forming part of the same experimental pipeline. Nuclei are outlined in white using DAPI as a reference. Scale bar—20 μm. Statistical significance indicated as follows: n.s.—p > 0.05.
Figure 5
Figure 5
BdS and alantolactone (ATL) synergistically potentiate olaparib-induced mitotic defects in p53 wildtype cancer cells. (A) Quantification (left) and representative images (right, Alexa Fluor 488; AF488) of percentages of U2OS cells displaying bulky anaphase bridges (DAPI-positive) after 72 h treatment with the specified compounds alone or in combination as indicated compared to vehicle only (DMSO). Each dataset represents a minimum of 4500 U2OS cells (3 independent experiments; n = 9; mean ± SEM). White arrowheads indicate anaphase bridges. Scale bar—20 μm. (B) Quantification (left) and representative images (right, Alexa Fluor 488; AF488) of percentages of U2OS cells displaying ultra-fine anaphase bridges (DAPI-negative, RPA1-positive; shown in magenta bars) in addition to bulky bridges (shown in green bars) after 72 h treatment with the specified compounds alone or in combination as indicated compared to DMSO. Each dataset represents a minimum of 1500 U2OS cells (3 replicates; n = 3; mean ± SEM). White arrowheads indicate opposite bridge ends for the two combination treatments. Scale bar—20 μm. (C) Quantification (left) and representative images (right, Alexa Fluor 488 and DAPI merge) of percentages of U2OS cells displaying γH2AX-negative (−) and -positive (+) micronuclei after 72 h treatment with the specified compounds alone or in combination as indicated compared to vehicle only (DMSO). Each dataset represents a minimum of 4500 U2OS cells (3 independent experiments; n = 9; mean ± SEM). Micronuclei are indicated using white arrowheads. Scale bar—20 μm. (D) Representative fluorescent images of multinucleated cells, with their DNA (DAPI; * high-exposure) and DNA damage (anti-γH2AX; Alexa Fluor 488) stained. Scale bar—20 μm. Statistical significance indicated as follows: n.s.—p > 0.05, *—p < 0.05, ***—p < 0.001, and ****—p < 0.0001.
Figure 6
Figure 6
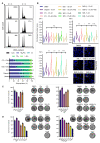
BdS and alantolactone (ATL) synergistically potentiate olaparib-induced cell growth inhibition in p53 wildtype cancer cells. (A) Propidium iodide (PI)-treated U2OS cell-cycle analysis after 48 h of drug treatment. Representative cell-cycle distributions depicting DNA content (top) and histograms (bottom) are shown for two independent experiments (n = 2; mean ± SEM). (B) Normalised nuclear area quantifications and representative images of the DAPI-stained U2OS nuclei (bottom right; 72 h time point) after treatment with olaparib (10 μM), ATL (2.5 μM), BdS (1.25, 2.5, 5 μM) and/or BdS-H2 (10 μM) at the indicated time points (dotted lines show median and quartiles). For the 24 h time point, each dataset represents a minimum of 25,000 cells (4 independent experiments; n = 672, except for BdS-H2 and its combination treatment which represent a minimum of 6250 cells—1 independent experiment; n = 168). For the 48 h time point, each dataset represents a minimum of 7500 cells (1 independent experiment; n = 168). For the 72 h time point, each dataset represents a minimum of 15,000 cells (3 independent experiments; n = 504). Scale bars—20 and 5 μm in inset. (C) Clonogenic survival assays with representative, stained colony images. Chronic treatment of U2OS cells (≥3 independent experiments; n ≥ 3; mean ± SEM) with alantolactone (ATL or A; 0.5 μM, left) and BdS (5 μM, right) in combination with olaparib (Ola or O; 0.625 μM). (D) Clonogenic survival assays with representative, stained colony images. Chronic treatment of U2OS cells (3 independent experiments; n ≥ 6; mean ± SEM) as in (C) (olaparib; 0.625 μM, BdS; 3.75 μM, ATL; 0.375 μM) but in combination with AZD1775, a WEE1 inhibitor (WEE1i or W; 0.05 μM). Controls for ATL and BdS are identical due to forming part of the same experimental pipeline (Ola, WEE1i, O + W). Statistical significance indicated as follows: n.s.—p > 0.05, *—p < 0.05, and ****—p < 0.0001.

Similar articles

References

    1. Jackson S.P., Bartek J. The DNA-Damage Response in Human Biology and Disease. Nature. 2009;461:1071–1078. doi: 10.1038/nature08467. - DOI - PMC - PubMed
    1. O’Connor M.J. Targeting the DNA Damage Response in Cancer. Mol. Cell. 2015;60:547–560. doi: 10.1016/j.molcel.2015.10.040. - DOI - PubMed
    1. Lord C.J., Ashworth A. PARP Inhibitors: Synthetic Lethality in the Clinic. Science. 2017;355:1152–1158. doi: 10.1126/science.aam7344. - DOI - PMC - PubMed
    1. Dias M.P., Moser S.C., Ganesan S., Jonkers J. Understanding and Overcoming Resistance to PARP Inhibitors in Cancer Therapy. Nat. Rev. Clin. Oncol. 2021;18:773–791. doi: 10.1038/s41571-021-00532-x. - DOI - PubMed
    1. Slade D. PARP and PARG Inhibitors in Cancer Treatment. Genes Dev. 2020;34:360–394. doi: 10.1101/gad.334516.119. - DOI - PMC - PubMed

MeSH terms