. 2022 Jan 20;23(3):1126.
doi: 10.3390/ijms23031126.

Roux-En-Y Gastric Bypass (RYGB) Surgery during High Liquid Sucrose Diet Leads to Gut Microbiota-Related Systematic Alterations

Affiliations

Roux-En-Y Gastric Bypass (RYGB) Surgery during High Liquid Sucrose Diet Leads to Gut Microbiota-Related Systematic Alterations

Laimdota Zizmare et al. Int J Mol Sci. .

Abstract

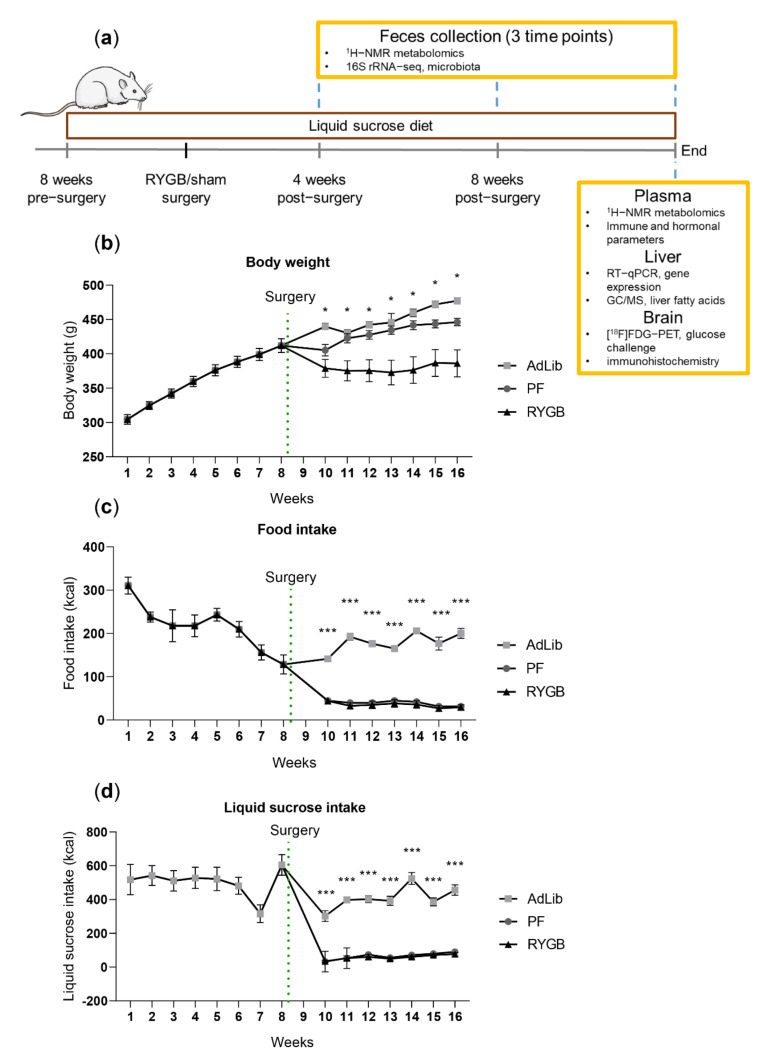
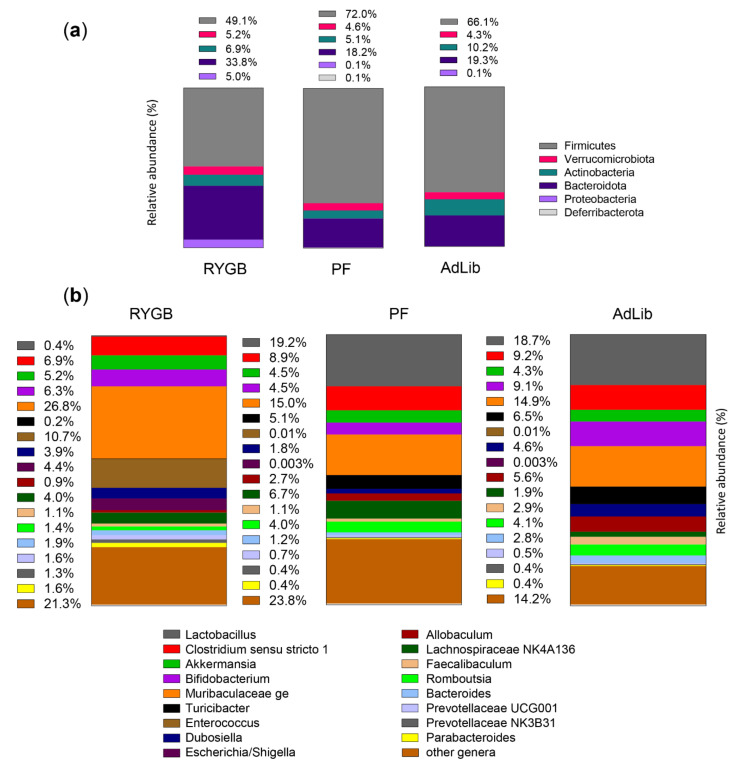
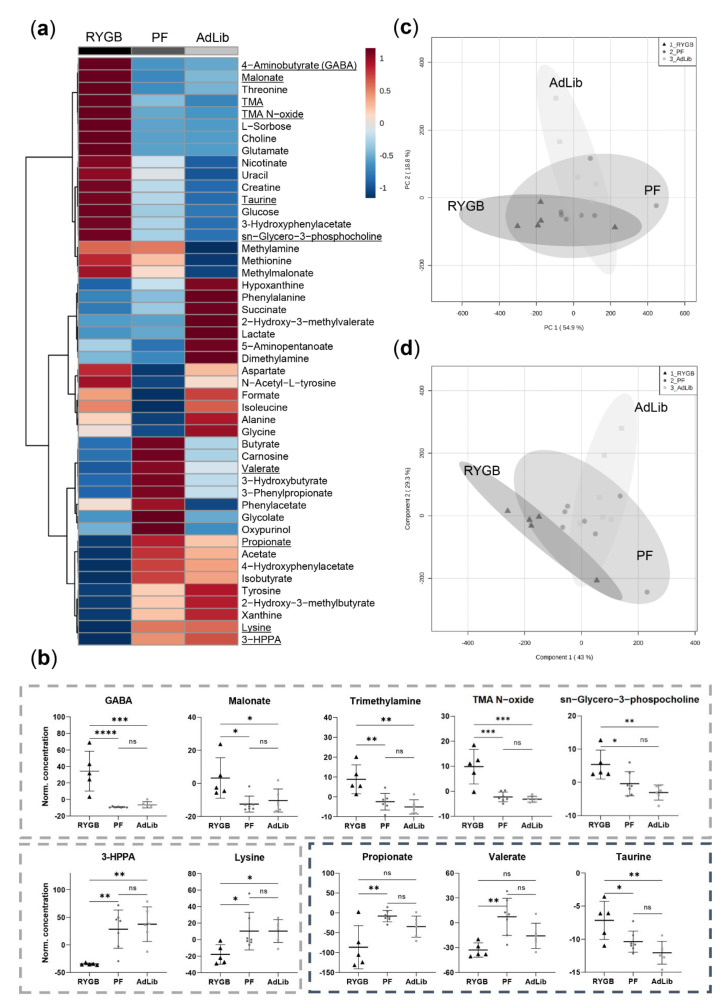
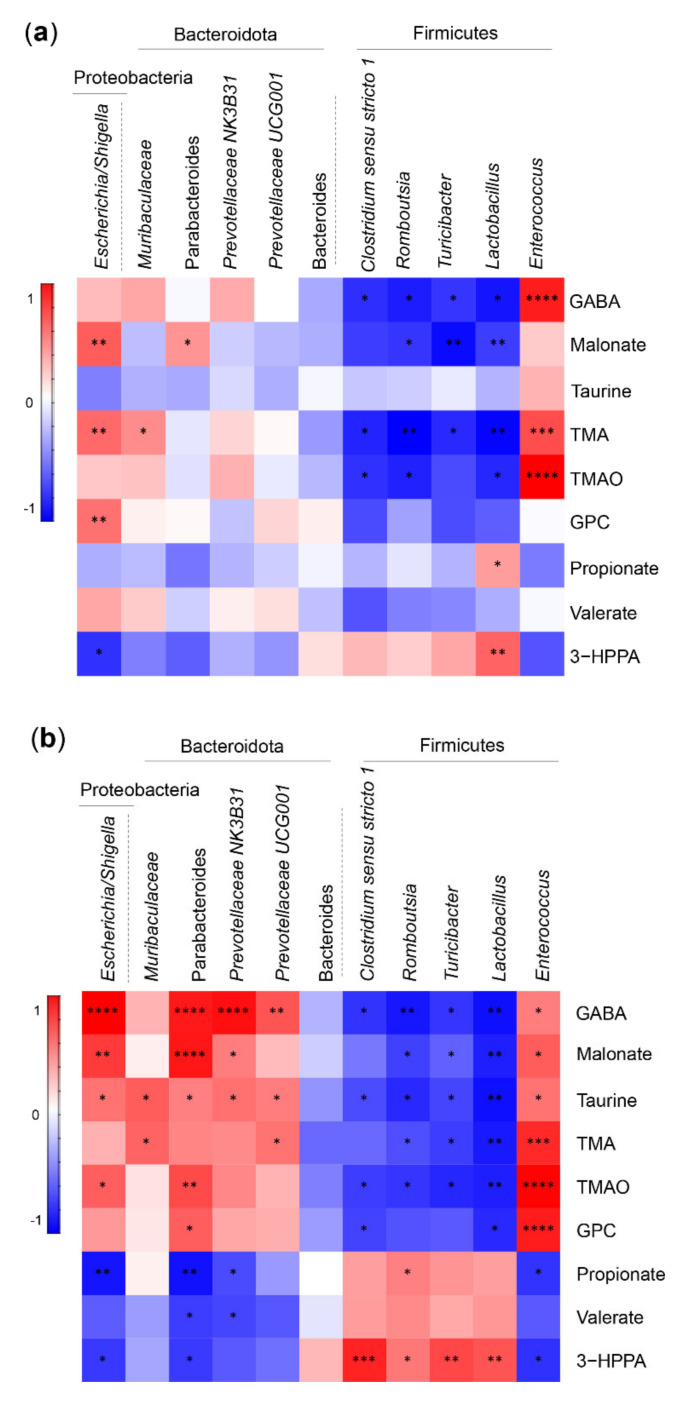
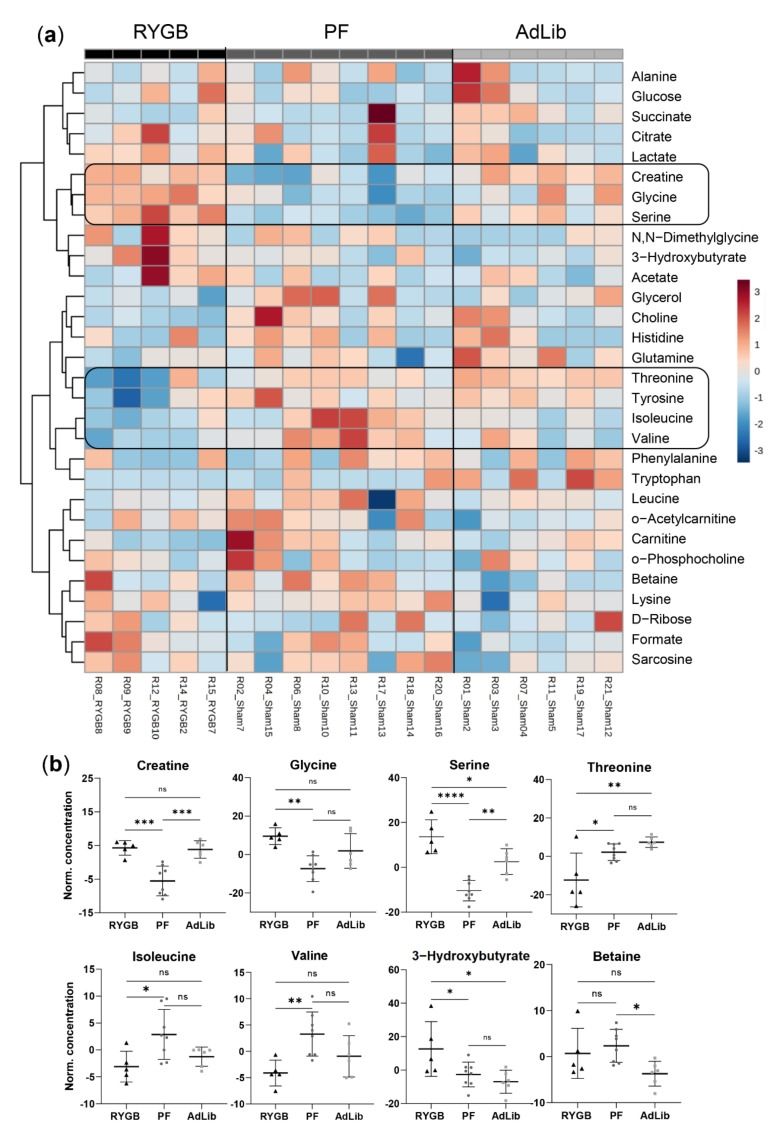
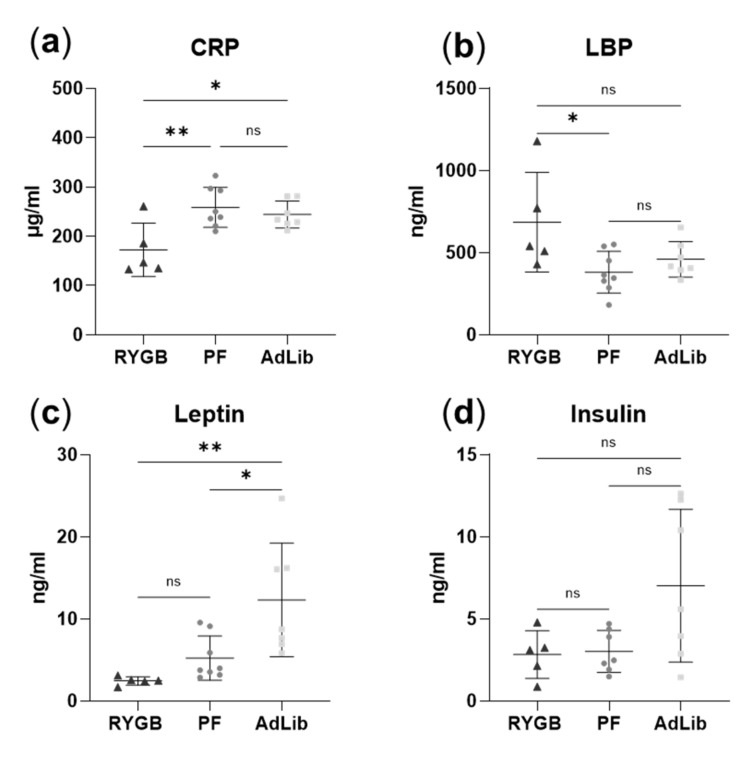
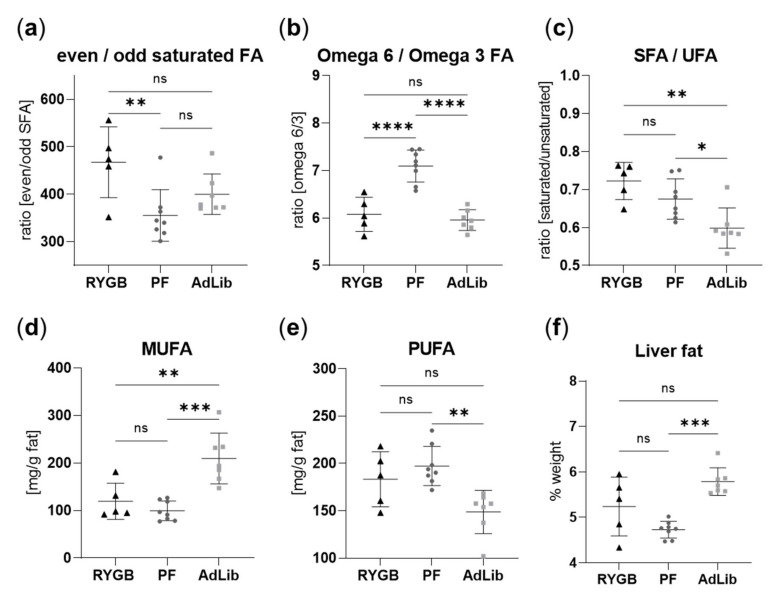
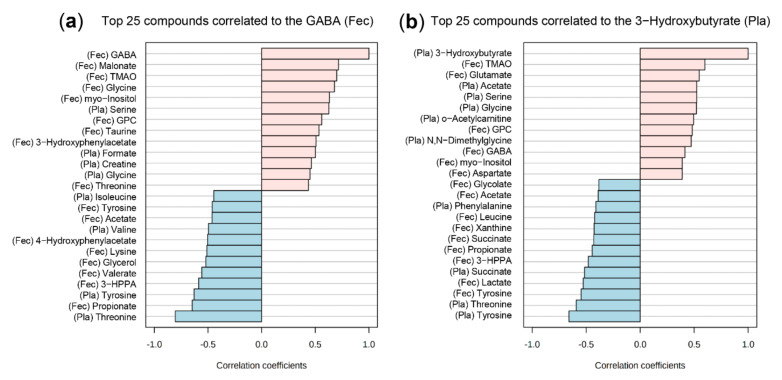
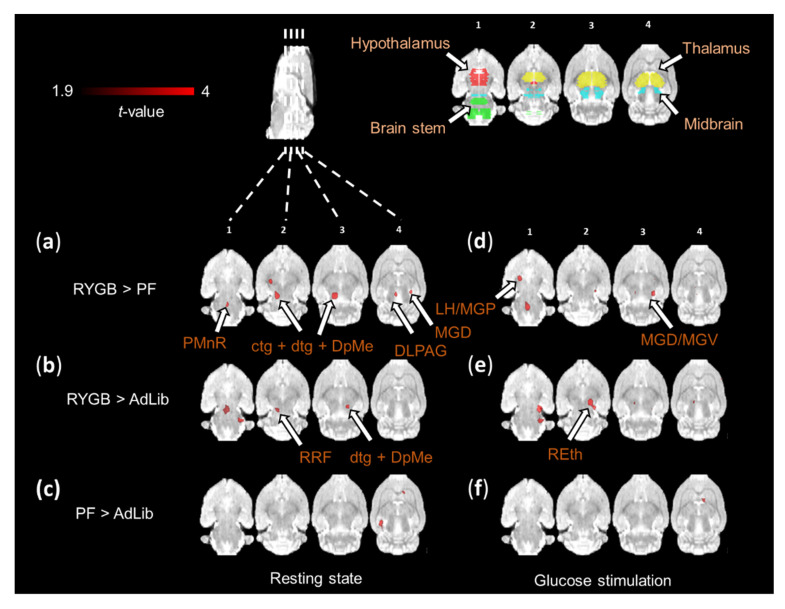
Roux-en-Y gastric bypass (RYGB) surgery has been proven successful in weight loss and improvement of co-morbidities associated with obesity. Chronic complications such as malabsorption of micronutrients in up to 50% of patients underline the need for additional therapeutic approaches. We investigated systemic RYGB surgery effects in a liquid sucrose diet-induced rat obesity model. After consuming a diet supplemented with high liquid sucrose for eight weeks, rats underwent RYGB or control sham surgery. RYGB, sham pair-fed, and sham ad libitum-fed groups further continued on the diet after recovery. Notable alterations were revealed in microbiota composition, inflammatory markers, feces, liver, and plasma metabolites, as well as in brain neuronal activity post-surgery. Higher fecal 4-aminobutyrate (GABA) correlated with higher Bacteroidota and Enterococcus abundances in RYGB animals, pointing towards the altered enteric nervous system (ENS) and gut signaling. Favorable C-reactive protein (CRP), serine, glycine, and 3-hydroxybutyrate plasma profiles in RYGB rats were suggestive of reverted obesity risk. The impact of liquid sucrose diet and caloric restriction mainly manifested in fatty acid changes in the liver. Our multi-modal approach reveals complex systemic changes after RYGB surgery and points towards potential therapeutic targets in the gut-brain system to mimic the surgery mode of action.

Keywords: 3-hydroxybutyrate; GABA; RYGB; gut-brain axis; inflammation; metabolomics; microbiome.


Conflict of interest statement

The authors declare no conflict of interest.

Figures

Figure 1
Figure 1
Overview of the experimental setup before and after the Roux-en-Y gastric bypass (RYGB) surgery. The timeline of the experiments, including sample collection points and analytical techniques (a). Average body weight (b), food intake (kcal) (c), and liquid sucrose intake (kcal) (d) are shown for ad libitum (AdLib), pair-fed (PF), and Roux-en-Y gastric bypass-operated (RYGB) rats. Data shown as mean ± SEM, p-values shown for RYGB vs. AdLib comparison. *** < 0.001, * < 0.05, two-way ANOVA, Tukey’s multiple comparisons test. RYGB (n = 5) black triangles, PF (n = 8) dark grey dots, AdLib (n = 7) light grey squares.
Figure 2
Figure 2
Gut microbiota composition. Bar graph representation of the most abundant taxa at the phylum (a) and genus (b) levels, illustrating a different microbiota composition between the groups with the RYGB animals displaying a higher abundance of Bacteroidota (particularly Muribaculaceae) and Proteobacteria (assigned to the family Enterobacteriaceae, genera Escherichia/Shigella), and a lower abundance of Firmicutes, even if more Enterococcus were found in this group, than in the Sham (PF and AdLib) animals, which had more Lactobacillus in their microbiota. Data from the three feces collection times are pooled. Mean relative abundance as % of the whole community is shown.
Figure 3
Figure 3
Feces metabolomics analysis eight weeks post-surgery. (a) Averaged heat map representing all the quantified metabolites with their relatively elevated (red) or lowered (blue) concentration differences between the groups. Metabolites significantly different between groups (one-way ANOVA) are underlined and represented as box plots (b): upregulated 4-aminobutyrate (GABA), malonate, trimethylamine (TMA), TMA N-oxide and sn-glycero-3-phosphocholine, and downregulated 3-hydroxyphenylpropionate (3-HPPA) and lysine in the RYGB animal group (grey dashed border signifies the metabolites that exhibited the same pattern already at four weeks post-surgery). Further, eight weeks post-surgery propionate and valerate were significantly downregulated, and taurine was upregulated in RYGB. Individual samples are represented as RYGB (n = 5) black triangles, PF (n = 8) dark grey dots, AdLib (n = 6) light grey squares with mean and standard deviation. p-values: **** < 0.0001, *** < 0.001, ** < 0.01, * < 0.05. (c) Principal component analysis (PCA) and (d) partial least squares discriminant analysis (PLSDA) regression model illustrate an overall sample cluster overlap. 95% confidence interval is represented as grey clouds.
Figure 4
Figure 4
Fecal microbiota and metabolomics correlation analysis. (a) Four weeks and (b) eight weeks post-surgery. The color scheme illustrates the correlation values scaled between −1 and 1. The red color indicates a positive correlation, blue—negative correlation. Statistical significance of these correlations illustrated as p-values: **** < 0.0001, *** < 0.001, ** < 0.01, * < 0.05. Correlation analysis involves all three group values (RYGB, PF, and AdLib pooled), correlation coefficients from the Pearson r distance measure. Abbreviations: GABA—4-aminobutyrate, TMA—trimethylamine, TMAO—trimethylamine N-oxide, GPC—sn-glycero-3-phosphocholine, and 3-HPPA—3-hydroxyphenyl propionate.
Figure 5
Figure 5
Plasma metabolite quantification analysis at the day of euthanasia. (a) Heat map illustration of all the metabolites profiled in all plasma samples, with unsupervised clustering towards similar metabolic patterns. (b) Individual box plots of one-way ANOVA significant metabolites: RYGB (n = 5) black triangles, PF (n = 8) dark grey dots, AdLib (n = 6) light grey squares, mean and standard deviation, p-values: **** < 0.0001, *** < 0.001, ** < 0.01, * < 0.05.
Figure 6
Figure 6
Immune and hormonal parameter profiling. Box plots visualizing the downregulated C-reactive protein (CRP) (a) and upregulated lipopolysaccharide-binding protein (LBP) (b) in RYGB compared to PF. Leptin was downregulated both in RYGB and PF animals compared to AdLib (c). No significant changes in insulin concentration were detected between groups (d). One-way ANOVA statistical significance, individual values illustrated for RYGB as black triangles (n = 5), PF dark grey dots (n = 8), AdLib light grey squares (n = 7), with mean and standard deviation, p-values: ** < 0.01, * < 0.05.
Figure 7
Figure 7
Hepatic fatty acid composition in RYGB and sham-operated animal groups. (a) Even to odd chain fatty acid (FA) ratio (w/w), (b) omega 6 to omega 3 FA ratio (w/w), (c) saturated (SFA) to unsaturated FA (UFA) ratio (w/w), (d) mono-unsaturated fatty acid (MUFA) concentration (mg/g fat), (e) poly-unsaturated fatty acid (PUFA) concentration (mg/g fat), (f) liver fat (% weight of liver). One-way ANOVA statistical significance, individual values illustrated for RYGB as black triangles (n = 5), PF dark grey dots (n = 8), AdLib light grey squares (n = 7), with mean and standard deviation, p-values: **** < 0.0001, *** < 0.001, ** < 0.01, * < 0.05.
Figure 8
Figure 8
Correlation analysis between the plasma and feces metabolites. Top 25 compounds correlated with (a) GABA and (b) 3-hydroxybutyrate. Correlation coefficients are based on Pearson r distance measure. Abbreviations: Pla—plasma metabolite, Fec—fecal metabolite, GABA—4-aminobutyrate GPC—sn-glycero-3-phosphocholine, 3-HPPA—3-hydroxyphenylpropionate, TMAO—trimethylamine N-oxide.
Figure 9
Figure 9
Functional PET brain activation maps at resting state and after glucose stimulation. Coronal brain sections show increase in relative [18F]FDG uptake at resting state and after glucose stimulation. Comparison of (a,d) RYGB > PF rats, (b,e) RYGB > AdLib and (c,f) PF > AdLib at a significance level of p ≤ 0.01. Brain region color code: red—hypothalamus, green—brain stem, yellow—thalamus, blue—midbrain. RYGB (n = 5), PF (n = 5) AdLib (n = 6). Abbreviations: PMnR—paramedian raphe nucleus, ctg—central tegmental tract, dtg—dorsal tegmental bundle, DpMe—deep mesencephalic nucleus, MGD—medial geniculate nucleus dorsal part, LH—lateral hypothalamus, MGP—medial globus pallidus, MGV—medial geniculate nucleus ventral part, RRF—retrorubral field, REth—retroethmoid nucleus.

Similar articles

Cited by

References

    1. Yang Y.-J., Ni Y.-H. Gut microbiota and pediatric obesity/non-alcoholic fatty liver disease. J. Formos. Med. Assoc. 2019;118:S55–S61. doi: 10.1016/j.jfma.2018.11.006. - DOI - PubMed
    1. Singer-Englar T., Barlow G., Mathur R. Obesity, diabetes, and the gut microbiome: An updated review. Expert Rev. Gastroenterol. Hepatol. 2019;13:3–15. doi: 10.1080/17474124.2019.1543023. - DOI - PubMed
    1. Pradhan A.D., Manson J.E., Rifai N., Buring J.E., Ridker P.M. C-reactive protein, interleukin 6, and risk of developing type 2 diabetes mellitus. JAMA-J. Am. Med. Assoc. 2001;286:327–334. doi: 10.1001/jama.286.3.327. - DOI - PubMed
    1. Jacka F.N., Cherbuin N., Anstey K.J., Sachdev P., Butterworth P. Western diet is associated with a smaller hippocampus: A longitudinal investigation. BMC Med. 2015;13:215. doi: 10.1186/s12916-015-0461-x. - DOI - PMC - PubMed
    1. Andersen C.J., Murphy K.E., Fernandez M.L. Impact of Obesity and Metabolic Syndrome on Immunity. Adv. Nutr. 2016;7:66–75. doi: 10.3945/an.115.010207. - DOI - PMC - PubMed

MeSH terms

Grants and funding