. 2022 Jan 20;23(3):1148.
doi: 10.3390/ijms23031148.

The Promoter of the Immune-Modulating Gene TIR-Containing Protein C of the Uropathogenic Escherichia coli Strain CFT073 Reacts to the Pathogen's Environment

Affiliations

The Promoter of the Immune-Modulating Gene TIR-Containing Protein C of the Uropathogenic Escherichia coli Strain CFT073 Reacts to the Pathogen's Environment

Jacqueline Hemberger et al. Int J Mol Sci. .

Abstract

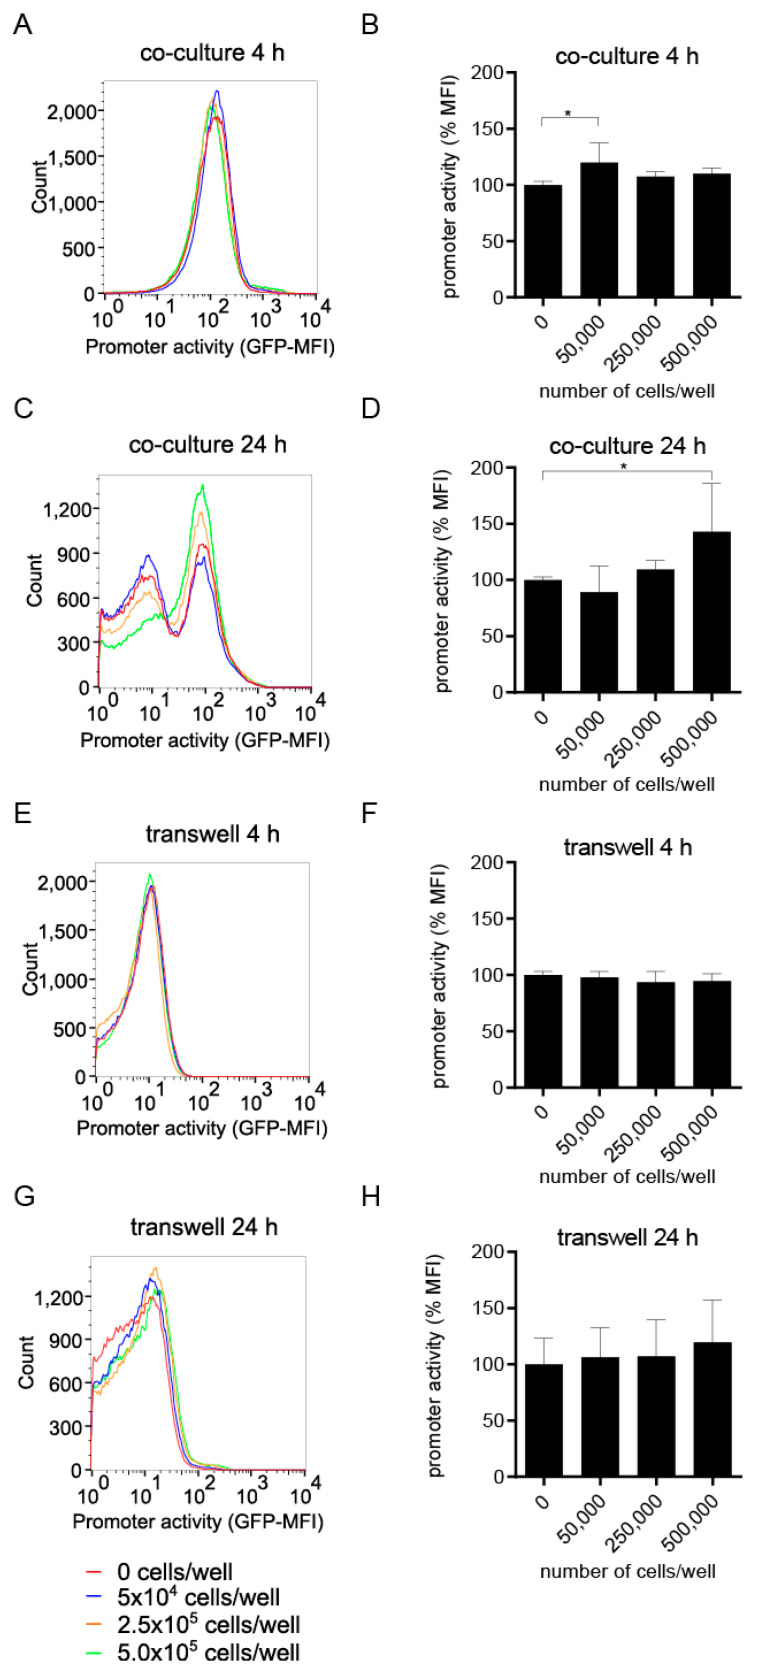
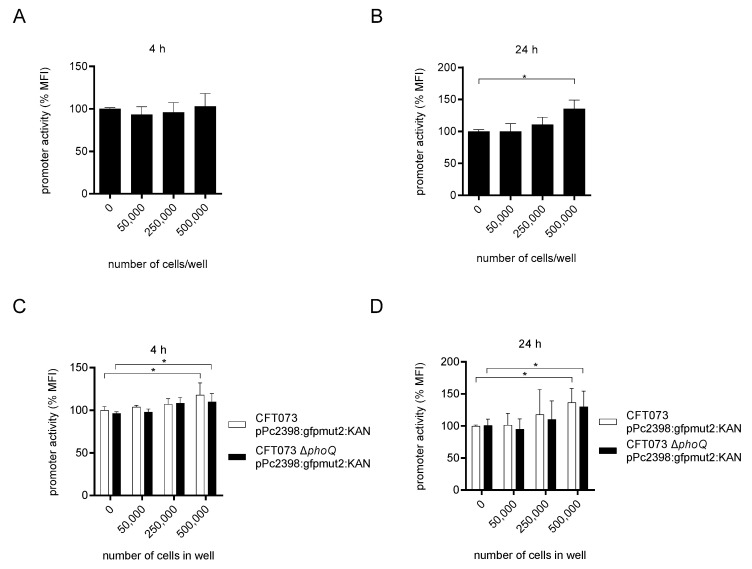
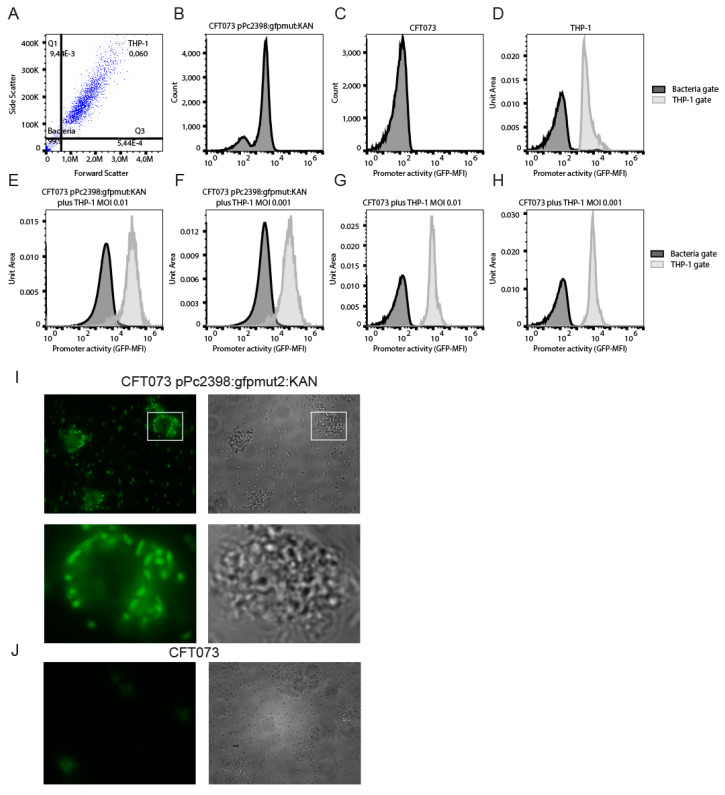
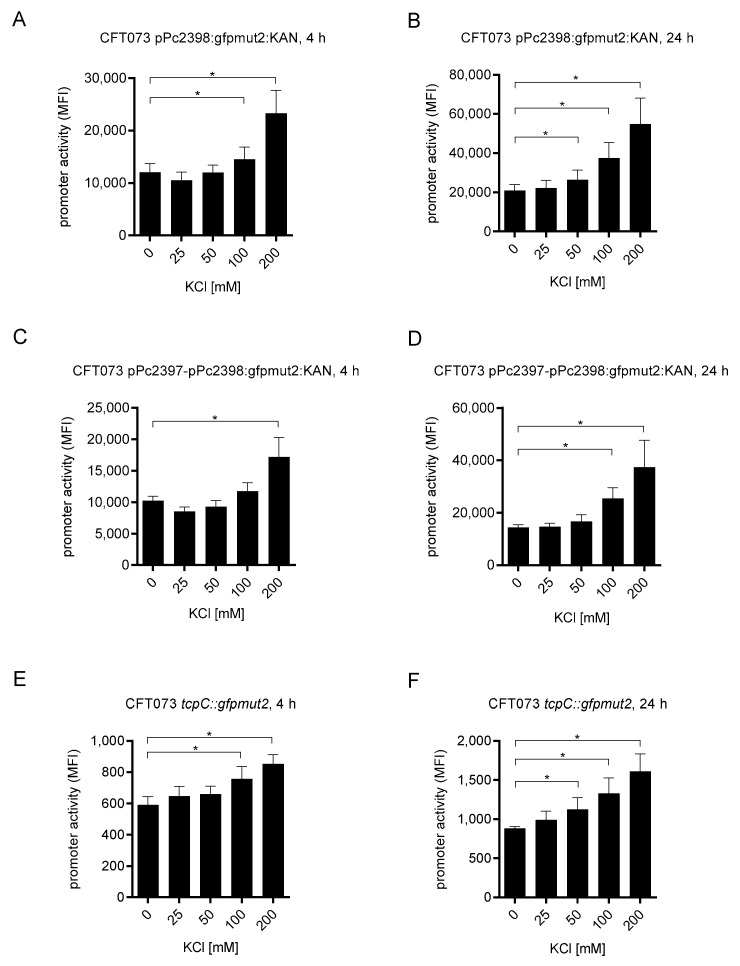
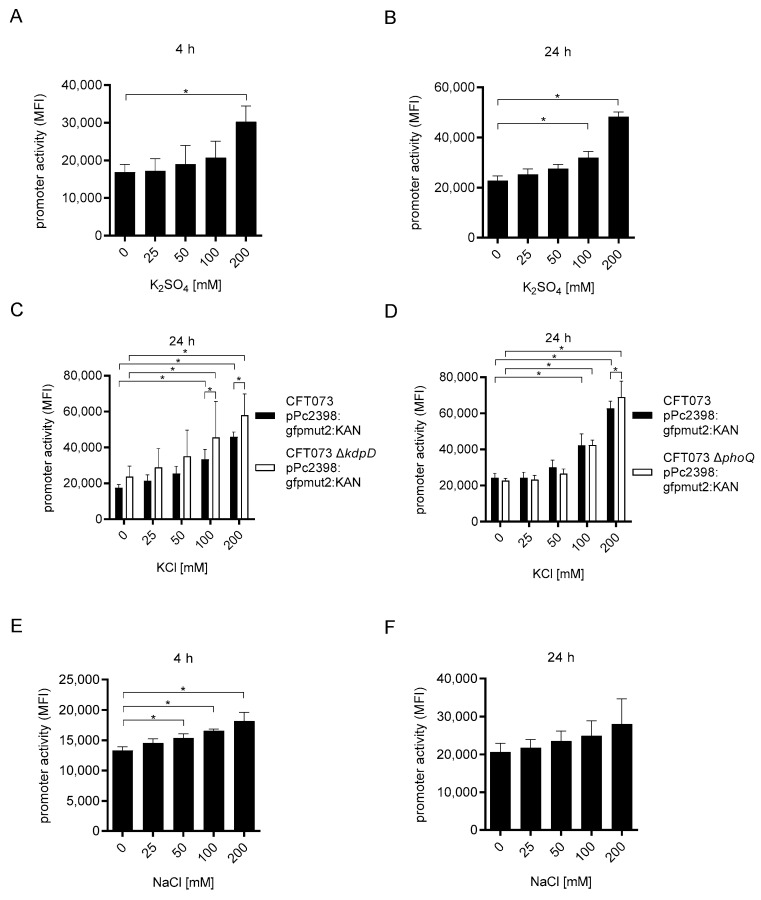
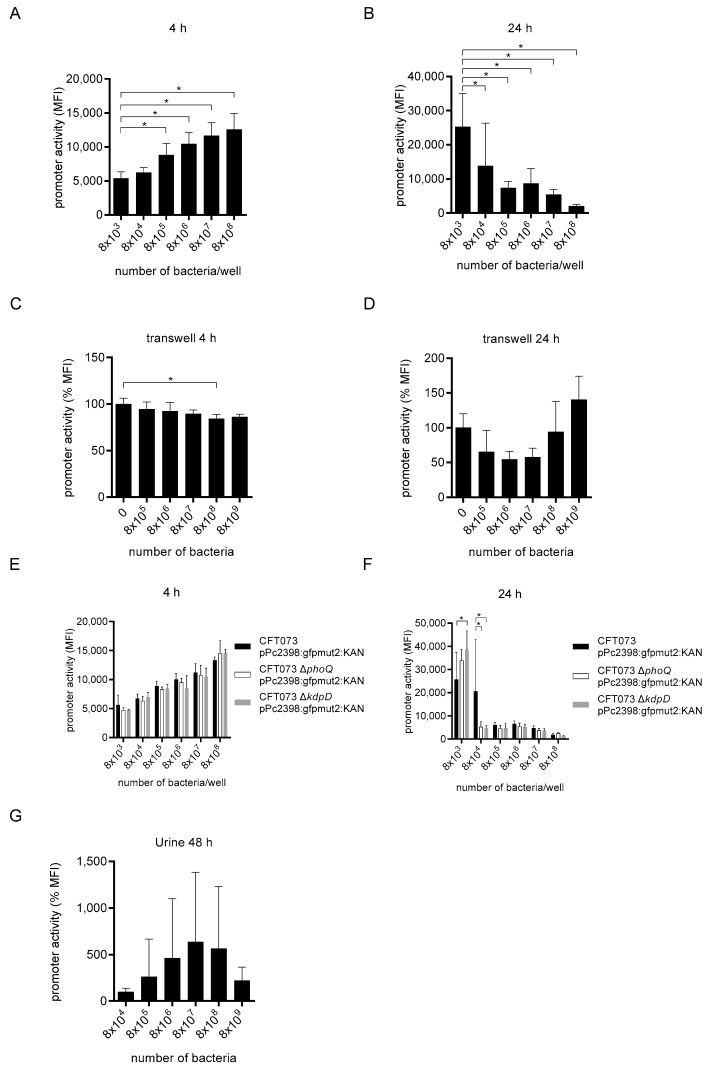
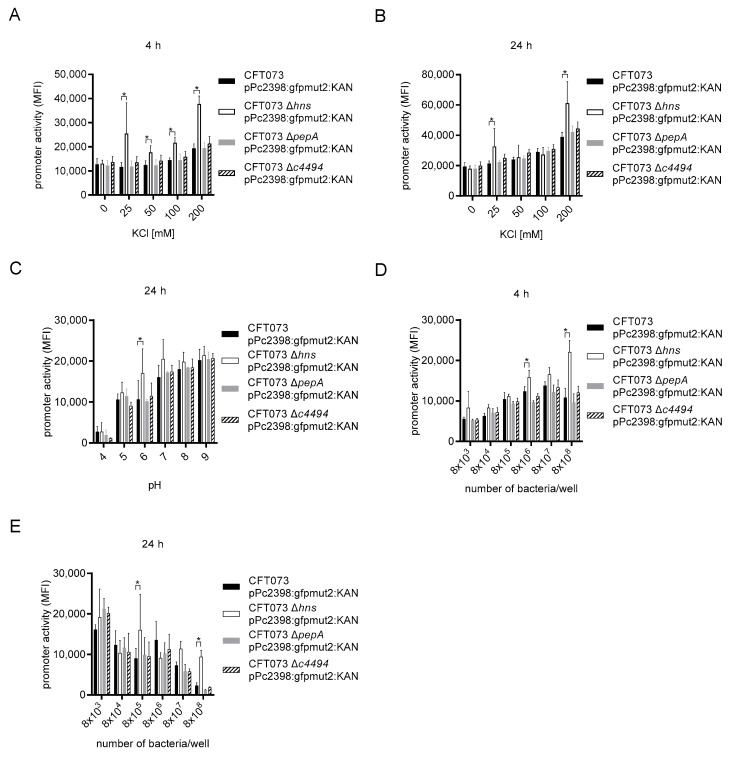
The TIR-containing protein C (TcpC) of the uropathogenic Escherichia coli strain CFT073 modulates innate immunity by interfering with the Toll-like receptor and NALP3 inflammasome signaling cascade. During a urinary tract infection the pathogen encounters epithelial and innate immune cells and replicates by several orders of magnitude. We therefore analyzed whether these cell types and also the density of the pathogen would induce the recently defined promoter of the CFT073 tcpC gene to, in time, dampen innate immune responses. Using reporter constructs we found that the uroepithelial cell line T24/83 and the monocytic cell line THP-1 induced the tcpC promoter. Differentiation of monocytic THP-1 cells to macrophages increased their potential to switch on the promoter. Cell-associated CFT073 displayed the highest promoter activity. Since potassium represents the most abundant intracellular ion and is secreted to induce the NLRP3 inflammasome, we tested its ability to activate the tcpC promoter. Potassium induced the promoter with high efficiency. Sodium, which is enriched in the renal cortex generating an antibacterial hypersalinity, also induced the tcpC promoter. Finally, the bacterial density modulated the tcpC promoter activity. In the search for promoter-regulating proteins, we found that the DNA-binding protein H-NS dampens the promoter activity. Taken together, different cell types and salts, present in the kidney, are able to induce the tcpC promoter and might explain the mechanism of TcpC induction during a kidney infection with uropathogenic E. coli strains.

Keywords: TcpC; bacterial density; host cell; potassium; sodium; uropathogenic Escherichia coli.


Conflict of interest statement

Authors have no conflict of interest to declare.

Figures

Figure 1
Figure 1
The epithelial cell line T24/83 induces the P2 promoter. We cultured CFT073 pPc2398:gfpmut:KAN in McCoy medium in the absence or presence of titrated amounts of T24/83 cells as indicated. Bacteria and T24/83 cells were either co-cultured (1.6 × 10⁷ bacteria/well, (AD)) or cultured in transwells (1.6 × 10⁸ bacteria/well, (EH)). We determined the P2 promoter activity after a culture period of 4 (A,B,E,F) or 24 h (C,D,G,H) by flow cytometry. (A,C,E,G) depict representative flow cytometry results. (B,D) show three independent experiments and (F,H) four independent experiments, each experiment was performed with three replicates. The measured promoter activity in (B,D,F,H) was normalized to the “0” control. * p < 0.05, ANOVA post-hoc Tukey.
Figure 2
Figure 2
Differentiation of the monocytic cell line THP-1 to macrophages increases their efficacy to induce the P2 promoter. We cultured CFT073 pPc2398:gfpmut:KAN in RPMI-1640 medium in the absence or presence of titrated amounts of LPS-stimulated (100 ng/mL) monocytic THP-1 cells as indicated. Bacteria and THP-1 cells were either co-cultured (1.6 × 10⁷ bacteria/well, (A,B)) or cultured in transwells (1.6 × 10⁸ bacteria/well, (C,D)). We determined the P2 promoter activity after a culture period of 4 (A,C) or 24 h (B,D) by flow cytometry. In (EH) we repeated the experiments described in (AD) with the exception that we used THP-1 cells, which we differentiated with PMA (100 ng/mL) for three days. Cells were not stimulated with LPS. Graphs depict three (AD,G,H) or six (E,F) independent experiments, each experiment was performed with three replicates. The measured promoter activity in (AH) was normalized to the “0” control. * p < 0.05, ANOVA post-hoc Tukey.
Figure 3
Figure 3
The PhoQ/P two-component system does not influence P2 induction by THP-1 cells. We co-cultured CFT073 ΔphoQ pPc2398:gfpmut:KAN (1.6 × 10⁷ bacteria/well) in RPMI-1640 medium in the absence or presence of titrated amounts of monocytic THP-1 cells as indicated (A,B). We determined the P2 promoter activity after a culture period of 4 (A) or 24 h (B) by flow cytometry. In (C,D) we differentiated THP-1 cells with PMA (100 ng/mL) for three days. Subsequently, we co-cultured wild-type CFT073 pPc2398:gfpmut:KAN (1.6 × 10⁷ bacteria/well) or CFT073 ΔphoQ pPc2398:gfpmut:KAN (1.6 × 10⁷ bacteria/ well) in the absence or presence of titrated amounts of differentiated THP-1 cells for 4 (C) or 24 h (D) as indicated and determined P2 promoter activity by flow cytometry. Graphs depict three independent experiments. Each experiment was performed with three replicates. The measured promoter activity in (AD) was normalized to the “0” control. * p < 0.05, ANOVA post-hoc Tukey.
Figure 4
Figure 4
CFT073 in close association with THP-1 cells activate P2 most intensively. We co-cultured CFT073 pPc2398:gfpmut:KAN and monocytic THP-1 cells in RPMI-1640 medium and defined by forward and side scatter the bacterial ((A), lower left quadrant: Bacteria) and cellular gate ((A), upper right quadrant: THP-1). (B) displays just CFT073 pPc2398:gfpmut:KAN (5 × 10³ bacteria/well), (C) just CFT073 (5 × 10³ bacteria/well) and (D) just monocytic THP-1 cells (5 × 10⁵ cells/well), which were used as controls. In parallel we co-cultured monocytic THP-1 cells (5 × 10⁵ cells/well) with CFT073 pPc2398:gfpmut:KAN (MOI = 0.01 or 0.001, (A,E,F)) or with CFT073 (MOI = 0.01 or 0.001, (G,H)) as indicated. We determined P2 promoter activity by flow cytometry after 24 h. Using the bacteria and THP-1 gate as defined in (A) we determined THP-1-non-associated (dark gray) and THP-1-associated bacteria (light gray). The dark gray area in (D) represents cellular debris of THP-1 cells. We modified the experiment described above and co-cultured monocytic THP-1 cells (5 × 10⁵ cells/well) with CFT073 pPc2398:gfpmut:KAN (MOI = 0.001, (I)) or with CFT073 (MOI = 0.001, (J)), as indicated. After 24 h of culture, we removed most of the bacteria by centrifugation and added gentamicin (400 µg/mL) for another 3 h to further reduce extracellular bacteria. We then monitored P2 promoter activity of cell-associated or non-associated bacteria by fluorescence microscopy ((I,J) left panels). White rectangles mark zoomed insets. Corresponding phase contrast pictures are also shown ((I,J), right panels).
Figure 5
Figure 5
CFT073 senses potassium chloride. We cultured CFT073 pPc2398:gfpmut2:KAN (overnight culture diluted 1:6) in M9-minimal medium in the absence or presence of increasing amounts of potassium chloride for 4 (A) or 24 h (B) and determined the P2 promoter activity by flow cytometry. We repeated the experiment with CFT073 pPc2397-Pc2398:gfpmut2:KAN (overnight culture diluted 1:6) to test a possible influence of the P1 promoter on P2 (C,D) and with CFT073 tcpC::gfpmut2 to test a chromosomal reporter strain (E,F). Graphs (A,B) depict 16 independent experiments, (C,D) depict four independent experiments, and (E,F) depict three independent experiments. Each experiment was performed with three replicates. * p < 0.05, ANOVA post-hoc Tukey.
Figure 6
Figure 6
Potassium and sodium induce P2. We cultured CFT073 pPc2398:gfpmut:KAN (overnight culture diluted 1:6) in M9-minimal medium in the absence or presence of increasing amounts of potassium sulfate as indicated for 4 (A) or 24 h (B). To test a possible involvement of the two-component systems KdpD/E (C) and PhoQ/P (D) in potassium detection, we cultured the corresponding gene-deficient strains CFT073 ΔkdpD pPc2398:gfpmut:KAN and CFT073 ΔphoQ pPc2398:gfpmut:KAN in the absence or presence of increasing amounts of potassium chloride as indicated and compared their response with the wild-type CFT073 pPc2397:gfpmut:KAN strain. Finally, we cultured CFT073 pPc2398:gfpmut:KAN in the absence or presence of increasing amounts of sodium chloride as indicated for 4 (E) or 24 h (F). In all experiments we determined P2 promoter activity by flow cytometry. Graphs (A,B,D) depict three, (C) four, (E) six, and (F) five independent experiments. Experiments in (A,B,E,F) were performed with one and, in (C,D), with three replicates. * p < 0.05, ANOVA post-hoc Tukey (A,B,E,F), two-way ANOVA and Sidak’s multiple comparison test (C,D).
Figure 7
Figure 7
The bacterial density activates P2. We cultured CFT073 pPc2398:gfpmut:KAN in McCoy medium in the indicated amounts for 4 (A) or 24 h (B). We repeated the experiment using transwell cultures with CFT073 pPc2398:gfpmut:KAN (3.2 × 10⁷ bacteria/well) in the absence or presence of increasing amounts of CFT073 as indicated for 4 (C) and 24 h (D). We analyzed the influence of the two-component systems KdpD/E and PhoQ/P to sense bacterial density by repeating the experiment in A and B with the strains CFT073 pPc2398:gfpmut:KAN, CFT073 ΔkdpD pPc2398:gfpmut:KAN or CFT073 ΔphoQ pPc2398:gfpmut:KAN for 4 (E) or 24 h (F). In (G) we cultured CFT073 pPc2398:gfpmut:KAN in the indicated amounts for 48 h in urine. In all experiments we determined the P2 promoter activity by flow cytometry. Graphs (A,B) depict nine independent experiments, each with one replicate, (C) depicts two independent experiments, each with two replicates, (D) depicts three independent experiments with two replicates, and (EG) depict three independent experiments. Experiments in (E,F) were performed with one, in (G) with four replicates. The measured promoter activity in (C,D) was normalized to the “0” control. * p < 0.05, ANOVA post-hoc Tukey (AD,G), two-way ANOVA and Dunnett’s multiple comparison test (E,F).
Figure 8
Figure 8
H-NS acts as negative regulator of P2. We cultured CFT073 pPc2398:gfpmut:KAN (overnight culture diluted 1:6), CFT073 Δhns pPc2398:gfpmut:KAN (overnight culture diluted 1:6), CFT073 ΔpepA pPc2398:gfpmut:KAN (overnight culture diluted 1:6), or CFT073 Δc4494 pPc2398:gfpmut:KAN (overnight culture diluted 1:6) in M9 minimal medium in the absence or presence of increasing amounts of potassium chloride for 4 (A) or 24 h (B), or increasing pH values for 24 h (C), or in McCoy medium in the indicated amounts for 4 (D) or 24 h (E). In all experiments we determined the P2 promoter activity by flow cytometry. Graphs (A,B) depict six independent experiments, (CE) depict three independent experiments. Each experiment was performed with one replicate. * p < 0.05, ANOVA post-hoc Tukey.
Figure 9
Figure 9
Strategy to generate gene-targeting cassettes. We used the primer pairs Pa, Pb (PCR 1) and Pc, Pd (PCR 2) to generate the “Giant” primers P1 and P2 which are homologous to the flanking regions of the target gene but also hybridize to the kanamycin cassette of pKD4. Using the primers P1 and kan iR (PCR 3) or P2 and kan iF (PCR 4) we amplified the 5′ and 3′ part of the kan-cassette. We then used the primers Pa and Pd (PCR 5) to fuse both parts and by that generating the complete gene targeting cassette. Primers Pef and PeR were used to verify the gene deficient mutant strains.

Similar articles

Cited by

References

    1. Mobley H.L., Green D.M., Trifillis A.L., Johnson D.E., Chippendale G.R., Lockatell C.V., Jones B.D., Warren J.W. Pyelonephritogenic Escherichia coli and killing of cultured human renal proximal tubular epithelial cells: Role of hemolysin in some strains. Infect. Immun. 1990;58:1281–1289. doi: 10.1128/iai.58.5.1281-1289.1990. - DOI - PMC - PubMed
    1. Welch R.A., Burland V., Plunkett G., III, Redford P., Roesch P., Rasko D., Buckles E.L., Liou S.R., Boutin A., Hackett J., et al. Extensive mosaic structure revealed by the complete genome sequence of uropathogenic Escherichia coli. Proc. Natl. Acad. Sci. USA. 2002;99:17020–17024. doi: 10.1073/pnas.252529799. - DOI - PMC - PubMed
    1. Cirl C., Miethke T. Microbial Toll/interleukin 1 receptor proteins: A new class of virulence factors. Int. J. Med. Microbiol. 2010;300:396–401. doi: 10.1016/j.ijmm.2010.04.001. - DOI - PubMed
    1. Waldhuber A., Puthia M., Wieser A., Cirl C., Durr S., Neumann-Pfeifer S., Albrecht S., Rommler F., Muller T., Zheng Y., et al. Uropathogenic Escherichia coli strain CFT073 disrupts NLRP3 inflammasome activation. J. Clin. Investig. 2016;126:2425–2436. doi: 10.1172/JCI81916. - DOI - PMC - PubMed
    1. Cirl C., Wieser A., Yadav M., Duerr S., Schubert S., Fischer H., Stappert D., Wantia N., Rodriguez N., Wagner H., et al. Subversion of Toll-like receptor signaling by a unique family of bacterial Toll/interleukin-1 receptor domain-containing proteins. Nat. Med. 2008;14:399–406. doi: 10.1038/nm1734. - DOI - PubMed

MeSH terms