. 2022 Jan 21;23(3):1170.
doi: 10.3390/ijms23031170.

Gal3 Plays a Deleterious Role in a Mouse Model of Endotoxemia

Affiliations

Gal3 Plays a Deleterious Role in a Mouse Model of Endotoxemia

Juan Carlos Fernández-Martín et al. Int J Mol Sci. .

Abstract

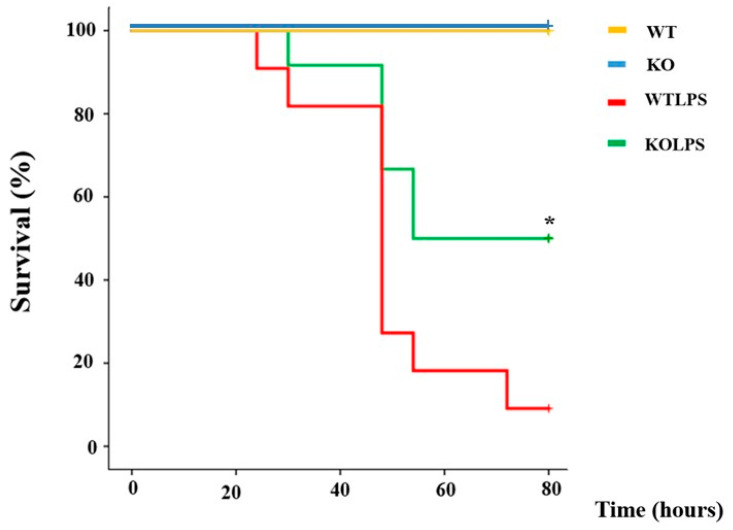
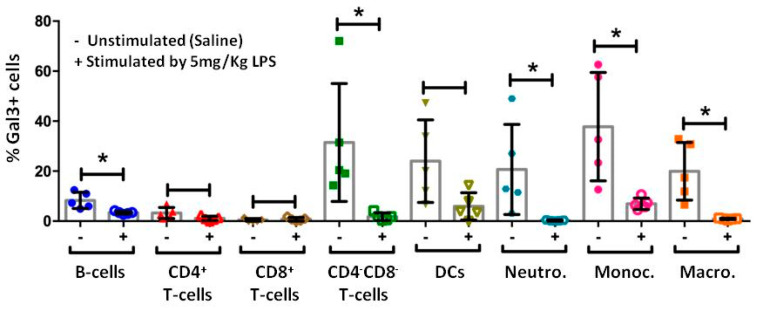
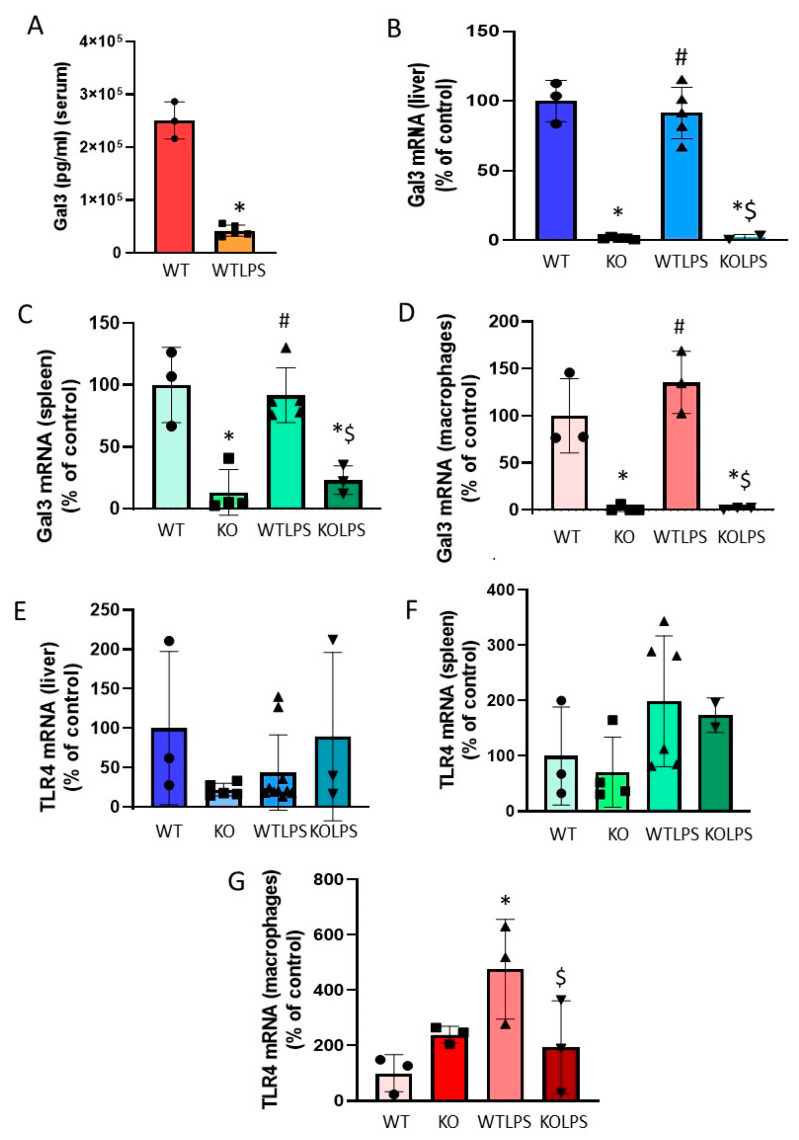
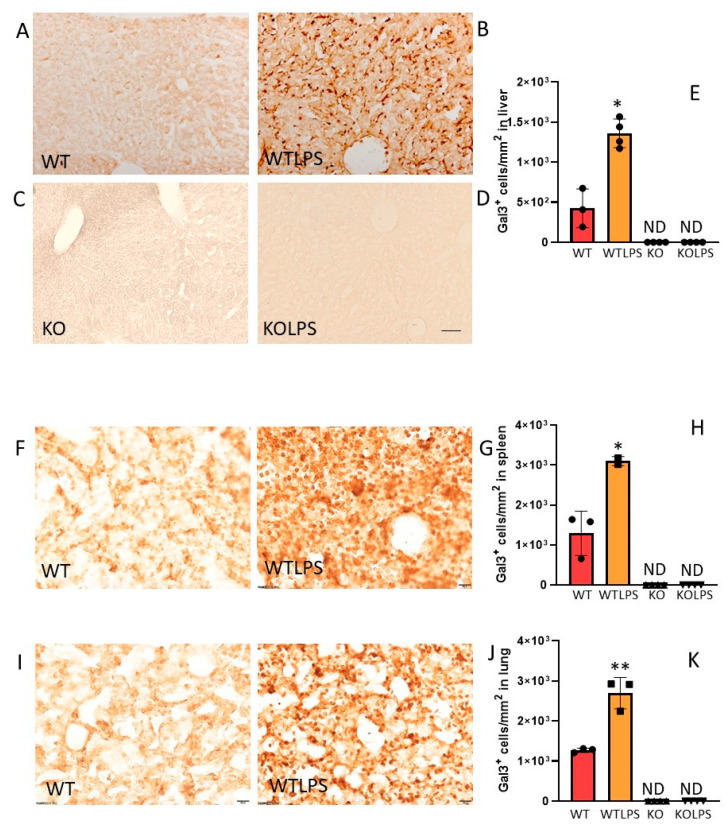
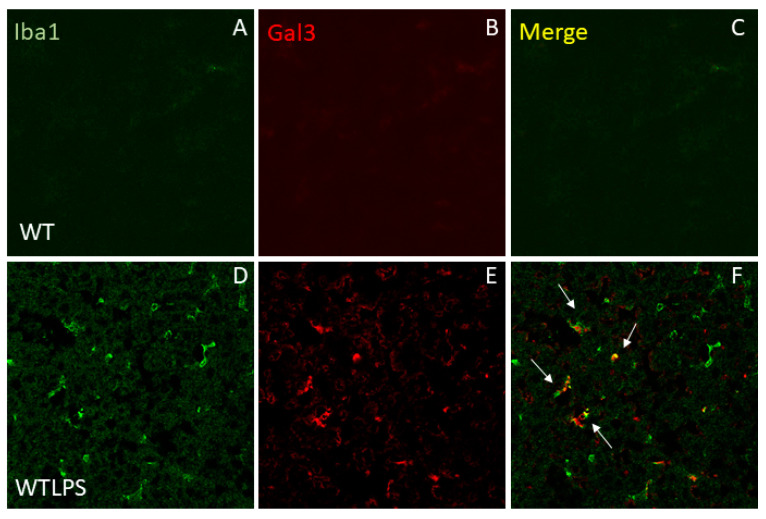
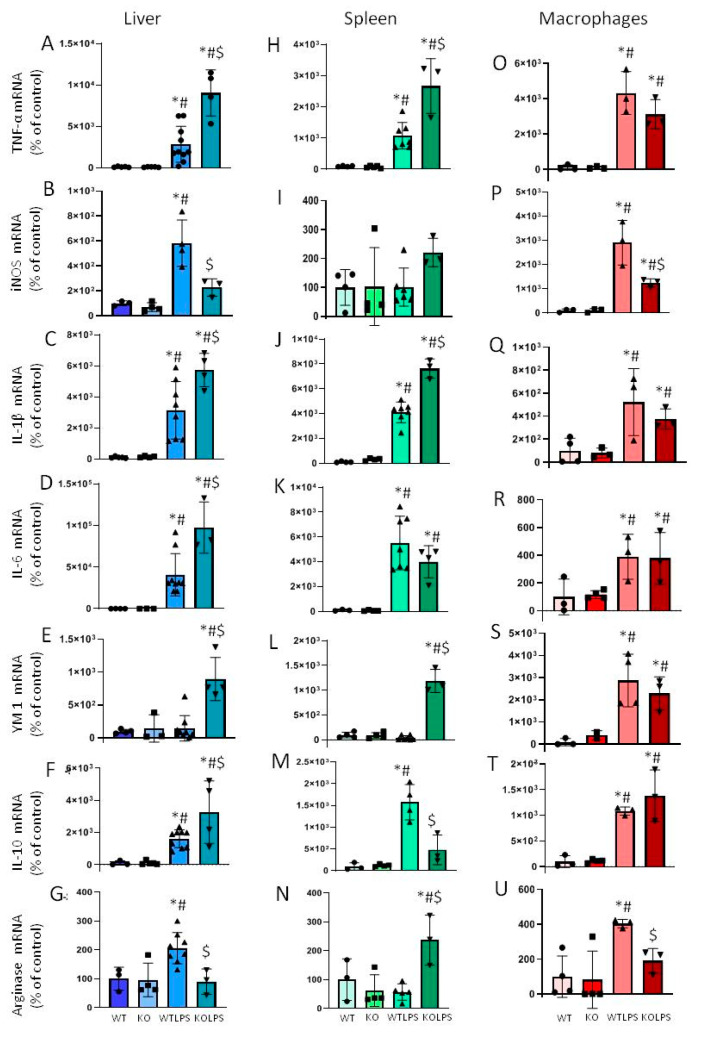
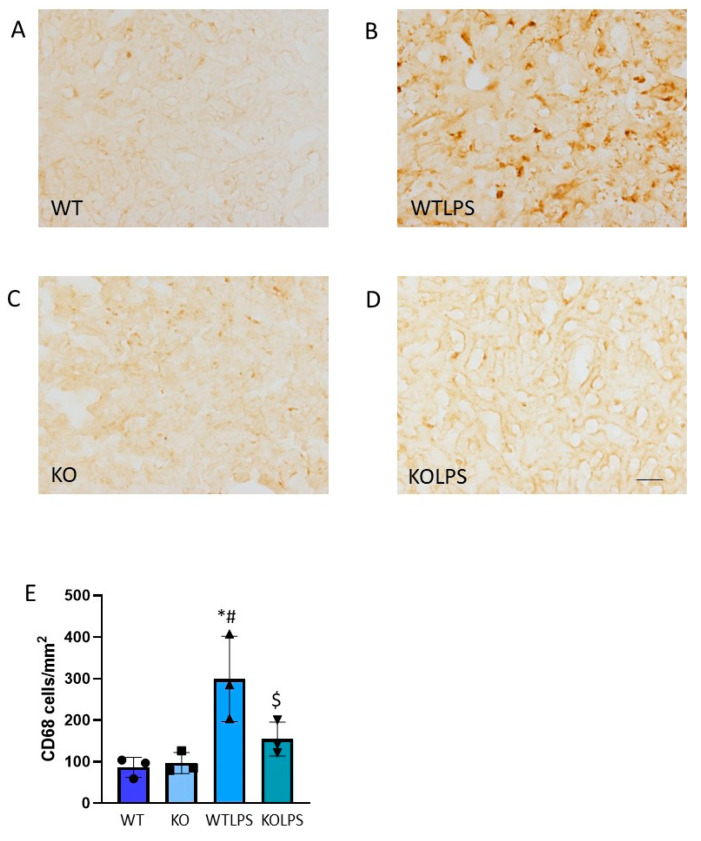
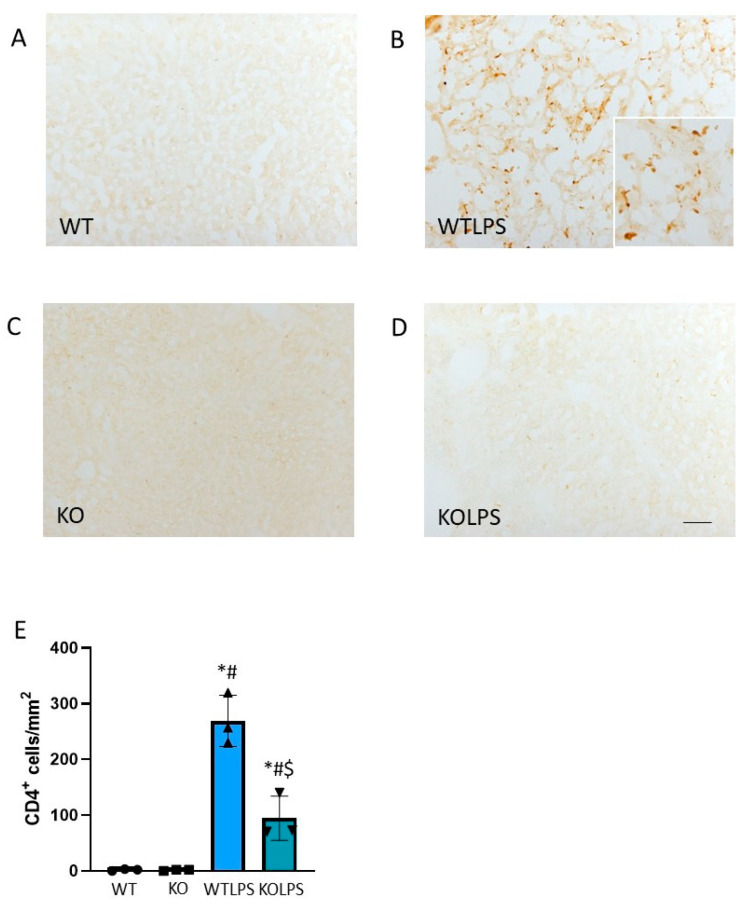
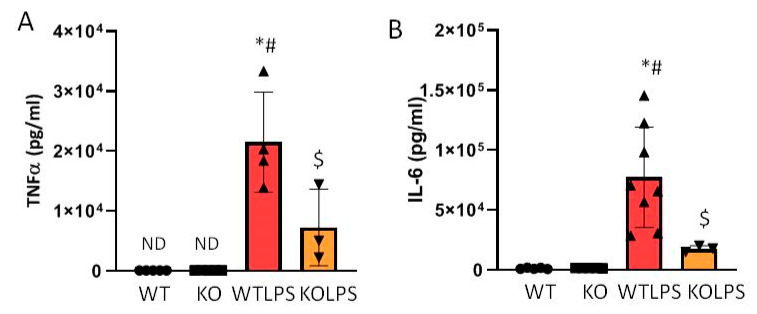
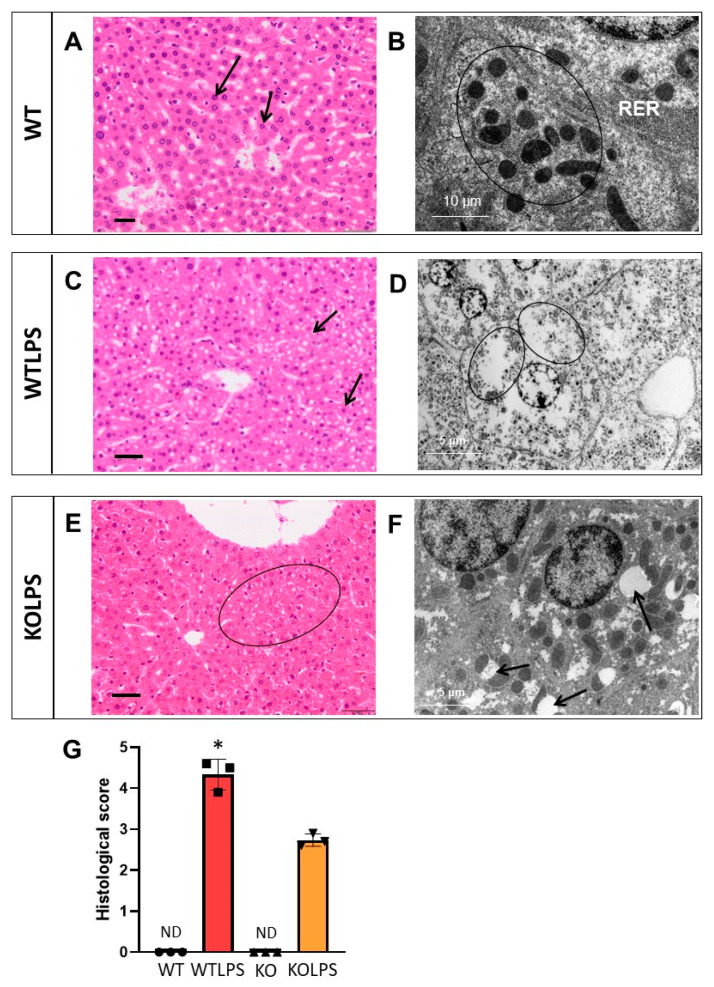
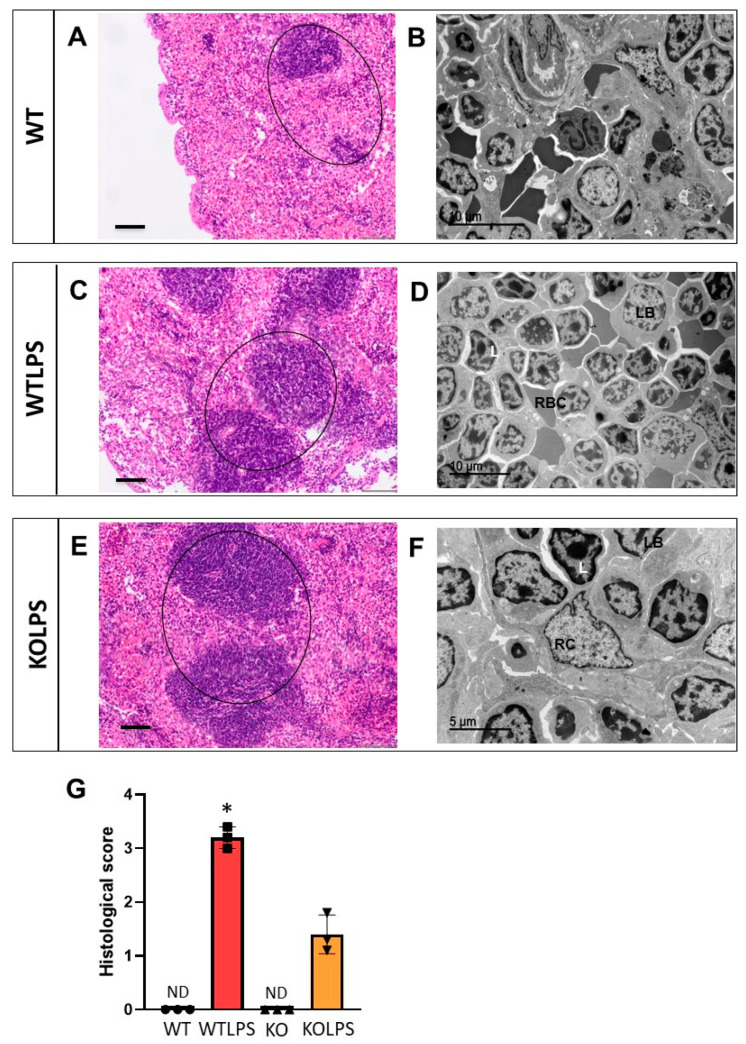
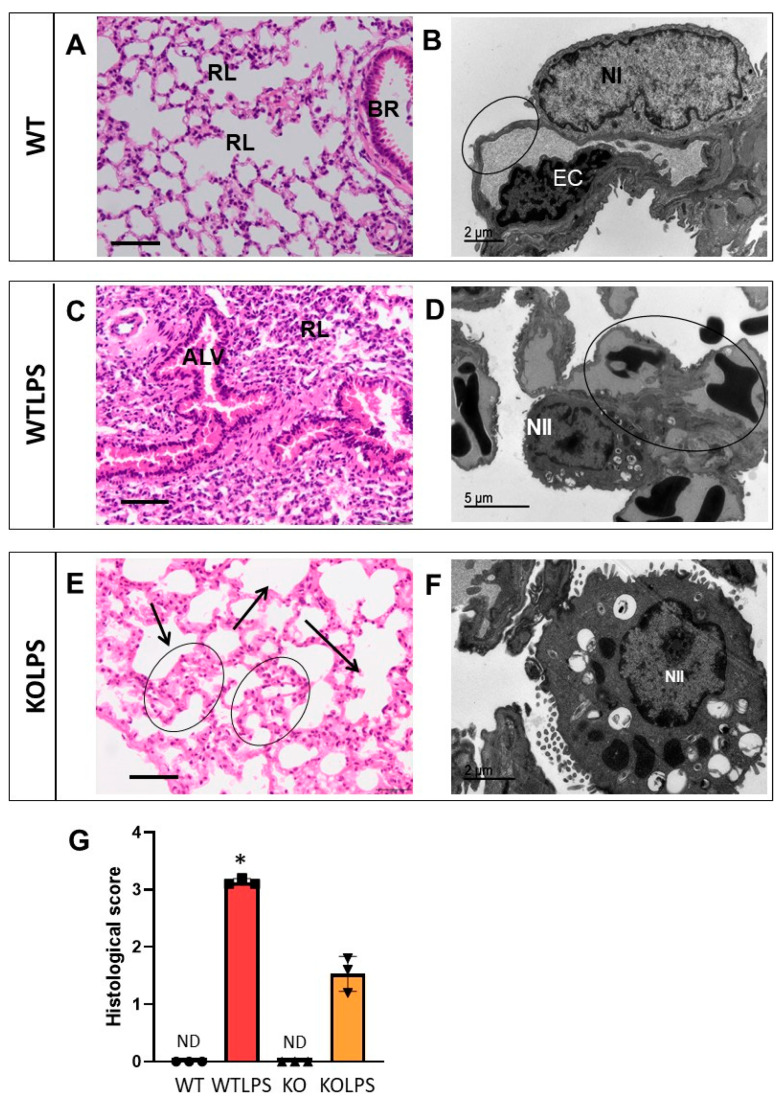
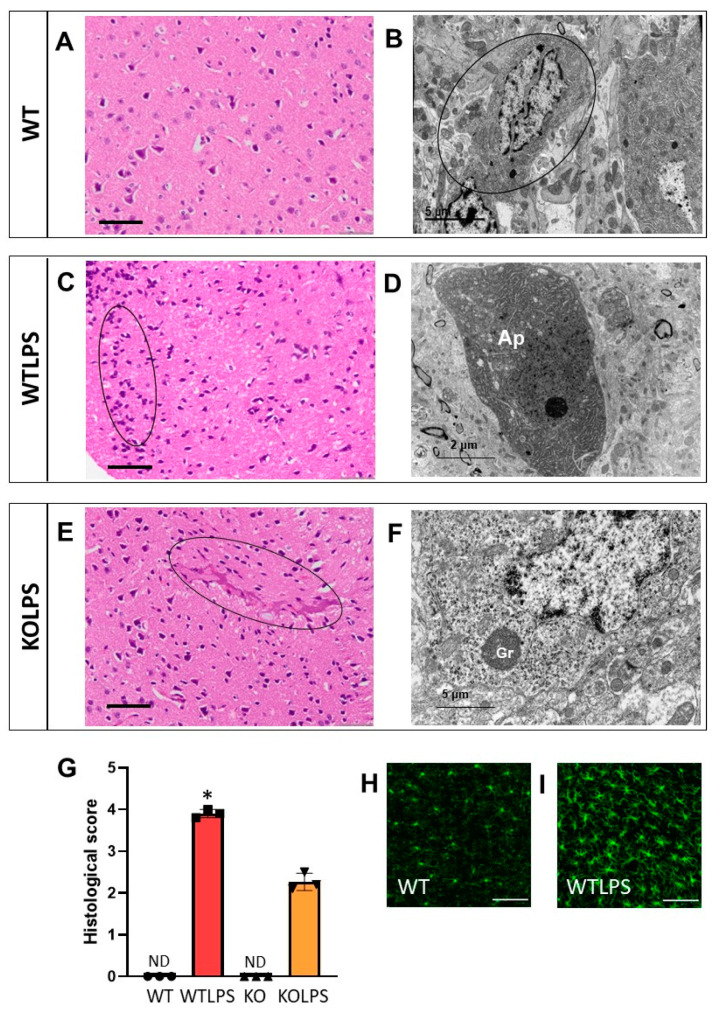
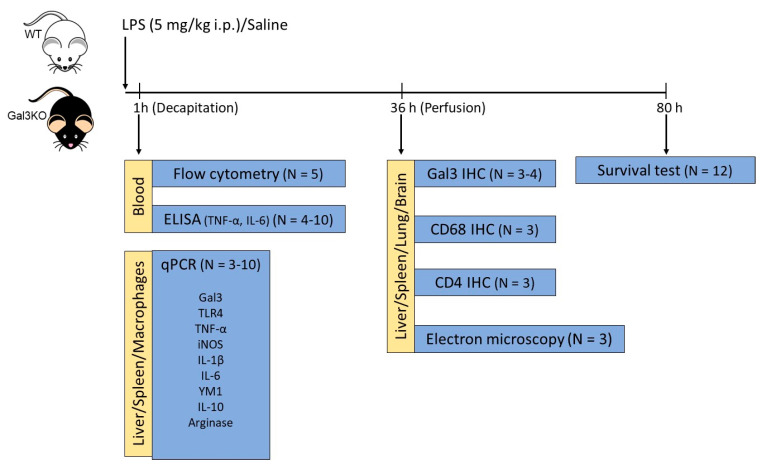
Lipopolysaccharide (LPS)-induced endotoxemia induces an acute systemic inflammatory response that mimics some important features of sepsis, the disease with the highest mortality rate worldwide. In this work, we have analyzed a murine model of endotoxemia based on a single intraperitoneal injection of 5 mg/kg of LPS. We took advantage of galectin-3 (Gal3) knockout mice and found that the absence of Gal3 decreased the mortality rate oflethal endotoxemia in the first 80 h after the administration of LPS, along with a reduction in the tissular damage in several organs measured by electron microscopy. Using flow cytometry, we demonstrated that, in control conditions, peripheral immune cells, especially monocytes, exhibited high levels of Gal3, which were early depleted in response to LPS injection, thus suggesting Gal3 release under endotoxemia conditions. However, serum levels of Gal3 early decreased in response to LPS challenge (1 h), an indication that Gal3 may be extravasated to peripheral organs. Indeed, analysis of Gal3 in peripheral organs revealed a robust up-regulation of Gal3 36 h after LPS injection. Taken together, these results demonstrate the important role that Gal3 could play in the development of systemic inflammation, a well-established feature of sepsis, thus opening new and promising therapeutic options for these harmful conditions.

Keywords: electron microscopy; endotoxemia; galectin-3; lipopolysaccharide; sepsis.


Conflict of interest statement

The authors declare no conflict of interest. The funders had no role in the design of the study; in the collection, analyses, or interpretation of data; in the writing of the manuscript, or in the decision to publish the results.

Figures

Figure 1
Figure 1
Gal3 knockout mice are more resistant to septic shock. WT and Gal3KO mice were subjected to an intraperitoneal injection of LPS (5 mg/kg of body weight) or saline solution (N = 12 animals per group). The mortality rate was monitored regularly for 80 h and represented as percentage of survival. The statistical analysis was performed using the Log-Rank Test. Abbreviations: WT, wild type mice; KO, Gal3 knockout mice; WTLPS, wild type mice treated with LPS; KOLPS, Gal3 knockout mice treated with LPS. *, p < 0.05.
Figure 2
Figure 2
Determination of Gal3 on immune cells of peripheral blood. Levels of Gal3 were determined by flow cytometry in peripheral blood of mice (N = 5 animals). Briefly, after blood collection, erythrocytes were lysed using an ammonium chloride lysis solution. Cells were washed and stained with surface marker antibodies for 20 min on ice. Gal-3 expression was analyzed in B-cells, CD4+ T-cells, CD8+ T-cells, double negative T-cells, dendritic cells, neutrophils, and macrophages. Results are expressed as median ± IQR. Statistical significance was calculated using the Mann–Whitney U test. Abbreviations: DCs, dendritic cells; Macro, macrophages; Monoc, monocytes; Neutro, neutrophils. *, p < 0.01.
Figure 3
Figure 3
Determination of Gal3 and TLR4. (A)The expression of Gal3 in serum was measured by ELISA. Blood samples were collected from the heart of mice 1 h after LPS/saline injection. Results are mean ± SD of N = 4–6 animals, expressed as ng/mLof the analyzed protein and relative to the WT group. Statistical significance (two tailed Student’s t test): p < 0.001. Using RT-PCR, the mRNA expression of Gal3 was measured in the liver (B), spleen (C), and peritoneal macrophages (D). Using RT-PCR, the mRNA expression of TLR4 was measured in the liver (E), spleen (F), and peritoneal macrophages (G). For PCR analysis, animals were culled 1 h after LPS/saline injection. Results are mean ± SD of N = 3–10 animals, normalized to β-actin and expressed as relative expression to the WT group. Statistical significance (one-way ANOVA followed by the LSD post hoc test for multiple comparisons): *—compared with WT group; #—compared with KO group; $—compared with WTLPS group; p < 0.001 for (BD), p < 0.05 for (G). Abbreviations: WT, wild type mice; KO, Gal3 knockout mice; WTLPS, wild type mice treated with LPS; KOLPS, Gal3 knockout mice treated with LPS.
Figure 4
Figure 4
Gal3 expression in the liver, lung, and spleen of mice from the different treatments assayed. (A) Section from liver showing some Gal3 positive cells in a WT animal. (B) Immunoreactivity of Gal3 in a liver section from a WT animal injected i.p. with LPS. (F) Section from spleen showing some Gal3 positive cells in a WT animal. (G) Immunoreactivity of Gal3 in a spleen section from a WT animal injected i.p. with LPS. Again, a strong reaction can be seen. (I) Section from lung showing some Gal3 positive cells in a WT animal. (G) Immunoreactivity of Gal3 in a lung section from a WT animal injected i.p. with LPS, showing a strong reaction. As expected, in the case of Gal3KO animals, immunoreactivity of Gal3 was not found in any treatment assayed (C,D). Scale bar: (AD), 100 μm; (FJ), 20 μm. Quantification of the density of Gal3 positive cells in liver (E), spleen (H), and lung (K) from the different treatments assayed. Results are mean ± SD of N = 3–4 animals, expressed as number of cells per mm2. Statistical significance (two tailed Student-t test): * p < 0.01; ** p < 0.05. Abbreviations: WT, wild type mice; WTLPS, wild type mice treated with LPS; KO, Gal3 knockout mice; KOLPS, Gal3 knockout mice treated with LPS.
Figure 5
Figure 5
Double immunofluorescence of Iba1 andGal3 expression. (A) Iba1 staining in the liver of a WT animal. Virtually, no monocytes/macrophages are infiltrated in control animals. (B) Section from liver showing some Gal3 positive cells in a WT animal. (C) Merge image showing co-localization of Iba1+ cells and Gal3+ cells. (D) Immunoreactivity of Iba1 in a liver section from a WT animal injected i.p. with LPS. A strong reaction can be seen. (E) Immunoreactivity of Gal3 in WT animals injected with LPS. (F) Merge image showing co-localization of Iba1+ cells and Gal3+ cells (arrows). Most Gal3+ cells co-localize with Iba1+ cells. Scale bar: 50 μm.
Figure 6
Figure 6
Effect of Gal3 deletion on the expression of TNF-α, iNOS, IL-1β, IL-6, YM1, IL-10, and arginase mRNAs in the liver, spleen, and macrophages of mice from the different treatments assayed, measured by RT-PCR (AU). Animals were culled 1 h after LPS/saline injection. Results are mean ± SD of N = 3–10 animals, normalized to β-actin and expressed as relative expression to the WT group. Statistical significance (one-way ANOVA followed by the LSD post hoc test for multiple comparisons): *—compared with WT group; #—compared with KO group; $—compared with WTLPS group; p < 0.001 for (AF,H,JM,O,P,T); p < 0.01 for (G,N,S); p < 0.05 for (Q,R,U). Abbreviations: WT, wild type mice; KO, Gal3 knockout mice; WTLPS, wild type mice treated with LPS; KOLPS, Gal3 knockout mice treated with LPS.
Figure 7
Figure 7
CD68 expression in liver. Representative immunostaining from sections of the different treatments assayed. WT (A) and KO (C) animals show a normal pattern of CD68 expression; however, the treatment with LPS produces a strong induction of CD68-positive cells in WT animals (B). Absence of Gal3 clearly reduces this effect (D). Scale bar: 100 μm. (E) Quantification of the density of CD68 positive cells in liver. Results are mean ± SD of N = 3 animals, expressed as number of cells per mm2. Statistical significance (one-way ANOVA followed by the LSD post hoc test for multiple comparisons): *—compared with WT group; #—compared with KO group; $—compared with WTLPS group; p < 0.01. Abbreviations: WT, wild type mice; WTLPS, wild type mice treated with LPS; KO, Gal3 knockout mice; KOLPS, Gal3 knockout mice treated with LPS.
Figure 8
Figure 8
CD4 expression in liver. Representative immunostaining from sections of the different treatments assayed. WT (A) and KO (C) animals show a normal pattern of CD4 expression; however, the treatment with LPS produces a strong induction of CD4-positive cells in WT animals (B). Absence of Gal3 clearly reduces this effect (D). Scale bar: 100 μm. (E) Quantification of the density of CD4 positive cells in liver. Results are mean ± SD of N = 3 animals, expressed as number of cells per mm2. Statistical significance (one-way ANOVA followed by the LSD post hoc test for multiple comparisons): *—compared with WT group; #—compared with KO group; $—compared with WTLPS group; p < 0.001. Abbreviations: WT, wild type mice; WTLPS, wild type mice treated with LPS; KO, Gal3 knockout mice; KOLPS, Gal3 knockout mice treated.
Figure 9
Figure 9
Determination of TNF-α and IL-6 levels in serum. TNF-α (A) and IL-6 (B) levels in serum of WT and Gal3KO animals. Blood samples were collected from the heart of mice 1 h after LPS/saline injection. Results are mean ± SD of N = 4–10 animals, expressed as ng/mLof the analyzed protein and relative to the WT group. Statistical significance (one-way ANOVA followed by the LSD post hoc test for multiple comparisons): *—compared with WT group; #—compared with KO group; $—compared with WTLPS group; p < 0.001. Abbreviations: WT, wild type mice; KO, Gal3 knockout mice; WTLPS, wild type mice treated with LPS; KOLPS, Gal3 knockout mice treated with LPS.
Figure 10
Figure 10
Histopathology of the livers of mice from the different treatments assayed. (A) Hepatic lobule with Remak cords of apparently normal hepatocytes (arrow). (B) Detail of hepatocyte with abundant rough endoplasmic reticulum (RER) and mitochondria (circle). (C) Hepatic parenchyma, appreciating abundant unilocular and multilocular steatosis (arrow). (D) Detail of hepatocyte with abundant diffuse fat (circle). (E) Detail of Remak cords with steatosis in the hepatocytes (circle). (F) Hepatocytes with vacuolations of its membranous system (arrow). (G) Histological score showing a semiquantitative analysis of steatosis in the liver. The pathology scores were as follows: 0, without significant injuries (0%); 1, minimum (<10%); 2, mild (11–25%); 3, moderate (26–50%); 4, marked (51–75%); 5, severe (>75%). Histopathological evaluation is performed in a blind manner by two highly experienced pathologists. Results are mean ± SD of N = 3 animals.Statistical significance (two tailed Student-t test): * p < 0.001. Abbreviations: WT, wild type mice; WTLPS, wild type mice treated with LPS; KO, Gal3 knockout mice; KOLPS, Gal3 knockout mice treated with LPS; ND, not damaged. (A,C,E), optical microscopy. Scale bars: 100 µm. (B,D,F), ultrastructural observations. Scale bars: (B), 10 µm; (D,F), 5 µm.
Figure 11
Figure 11
Histopathology of the spleens of mice from the different treatments assayed. (A) Apparently normal spleen. Normal white pulp (lymphoid follicles) (circle). (B) Marginal zone of the apparently normal spleen. (C) Hypertrophy and hyperplasia of lymphoid follicles very marked (circle). (D) Detail of lymphoid follicle with abundant lymphoblasts (LB) and lymphocytes (L), and some red blood cells (RBC). (E) Detail of spleen with hypertrophy and especially hyperplasia of the lymphoid follicles (circle). (F) Detail of lymphoid follicle with lymphocytes (L), lymphoblasts (LB) and reticular cells (RC). (G) Histological score showing a semiquantitative analysis of hypertrophy and hyperplasia of lymphoid follicles in the spleen. The pathology scores were as follows: 0, without significant injuries (0%); 1, minimum (<10%); 2, mild (11–25%); 3, moderate (26–50%); 4, marked (51–75%); 5, severe (>75%). Histopathological evaluation is performed in a blind manner by two highly experienced pathologists. Results are mean ± SD of N = 3 animals. Statistical significance (two tailed Student-t test), * p < 0.001. Abbreviations: WT, wild type mice; WTLPS, wild type mice treated with LPS; KO, Gal3 knockout mice; KOLPS, Gal3 knockout mice treated with LPS; ND, not damaged. (A,C,E), optical microscopy. Scale bars: 100 µm. (B,D,F), ultrastructural observations. Scale bars: (B,D), 10 µm; (F), 5 µm.
Figure 12
Figure 12
Histopathology of the lungs of mice from the different treatments assayed. (A) Lung in which an apparently normal bronchus (BR) and respiratory lobules (RL) stand out. (B) Detail of capillary and pulmonary alveolus separated by the respiratory barrier (circle) formed by the endothelial cell (EC) and pneumocyteI (NI). (C) Detail of lung that shows a marked atelectasis in both respiratory lobule (RL) and alveoli (ALV). (D) Detail of lung with capillary hyperemia (circle) and hypertrophy of pneumocytes II (NII). (E) Lung detail showing atelectasis zones (circle) and emphysema (arrow). (F) Septal hypertrophy of pneumocytes II (NII). (G) Histological score showing a semiquantitative analysis of atelectasis in the lung. The pathology scores were as follows: 0, without significant injuries (0%); 1, minimum (<10%); 2, mild (11–25%); 3, moderate (26–50%); 4, marked (51–75%); 5, severe (>75%). Histopathological evaluation is performed in a blind manner by two highly experienced pathologists. Results are mean ± SD of N = 3 animals. Statistical significance (two tailed Student-t test), * p < 0.001. Abbreviations: WT, wild type mice; WTLPS, wild type mice treated with LPS; KO, Gal3 knockout mice; KOLPS, Gal3 knockout mice treated with LPS; ND, not damaged. (A,C,E), optical microscopy. Scale bars: 100 µm. (B,D,F), ultrastructural observations. Scale bars: (B,F), 2 µm; (D), 5 µm.
Figure 13
Figure 13
Histopathology of the brains of mice from the different treatments assayed. (A) Detail of cerebral cortex with abundant neurons. (B) Detail of apparently normal neuron and oligodendrocyte (circle). (C) Detail of cerebral cortex, showing mobilization of glia cells (circle). (D) Detail of a damaged neuron densified and vacuolized. (E) Detail of cerebral cortex with a tenuous hyperemia (circle). (F) Detail of neuron with lipofucsin precursor granules (Gr). (G) Histological score showing brain damage. The pathology scores were as follows: 0, without significant injuries (0%); 1, minimum (<10%); 2, mild (11–25%); 3, moderate (26–50%); 4, marked (5–75%); 5, severe (>75%). Histopathological evaluation is performed in a blind manner by two highly experienced pathologists. Results are mean ± SD of N = 3 animals. Statistical significance (two tailed Student-t test), * p < 0.001. Abbreviations: WT, wild type mice; WTLPS, wild type mice treated with LPS; KOLPS, Gal3 knockout mice treated with LPS; ND, not damaged. (A,C,E), optical microscopy. Scale bars: 100 µm. (B,D,F), ultrastructural observations. Scale bars: (B,F), 5 µm; (D), 2 µm. (H) Immunofluorescence of Iba1 showing a normal patter in microglial cells staining. (I) When animals were treated with LPS microglial cells activate and proliferate. Scale bars (H,I): 100 µm.
Figure 14
Figure 14
Timeline of the treatments with LPS in animals, and points at which the different parameters have been measured. WT and Gal3KO animals were injected with either LPS or saline and sacrificed at different time points depending on the technique assayed. The number of animals used in each experiment isalso indicated.

Similar articles

Cited by

References

    1. Andreasen A.S., Krabbe K.S., Krogh-Madsen R., Taudorf S., Pedersen B.K., Moller K. Human Endotoxemia as a Model of Systemic Inflammation. Curr. Med. Chem. 2008;15:1697–1705. doi: 10.2174/092986708784872393. - DOI - PubMed
    1. Fink M.P. Animal models of sepsis. Virulence. 2014;5:143–153. doi: 10.4161/viru.26083. - DOI - PMC - PubMed
    1. Chousterman B.G., Swirski F., Weber G.F. Cytokine storm and sepsis disease pathogenesis. Semin. Immunopathol. 2017;39:517–528. doi: 10.1007/s00281-017-0639-8. - DOI - PubMed
    1. Takeuchi O., Akira S. Pattern Recognition Receptors and Inflammation. Cell. 2010;140:805–820. doi: 10.1016/j.cell.2010.01.022. - DOI - PubMed
    1. Park B.S., Lee J.-O. Recognition of lipopolysaccharide pattern by TLR4 complexes. Exp. Mol. Med. 2013;45:e66. doi: 10.1038/emm.2013.97. - DOI - PMC - PubMed