. 2022 Jan 21;23(3):1171.
doi: 10.3390/ijms23031171.

Evidence for Inhibitory Perturbations on the Amplitude, Gating, and Hysteresis of A-Type Potassium Current, Produced by Lacosamide, a Functionalized Amino Acid with Anticonvulsant Properties

Affiliations

Evidence for Inhibitory Perturbations on the Amplitude, Gating, and Hysteresis of A-Type Potassium Current, Produced by Lacosamide, a Functionalized Amino Acid with Anticonvulsant Properties

Hsin-Yen Cho et al. Int J Mol Sci. .

Abstract

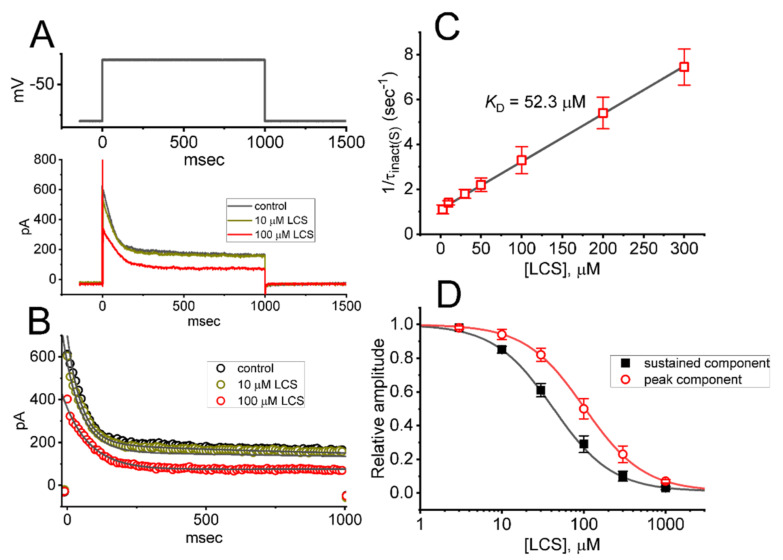
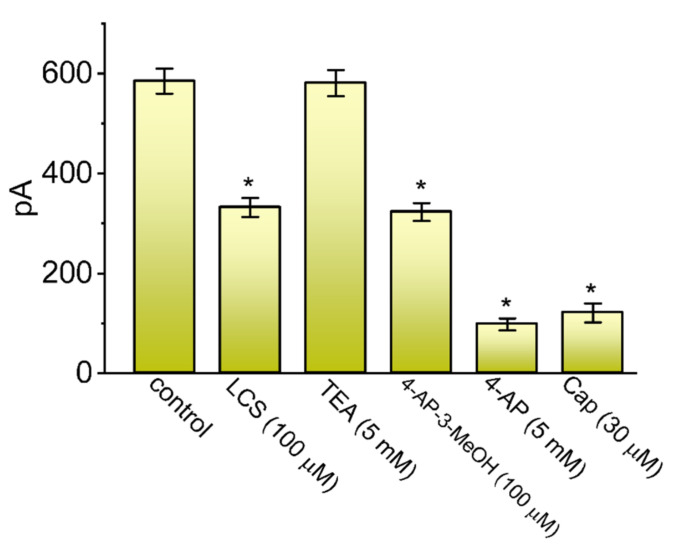
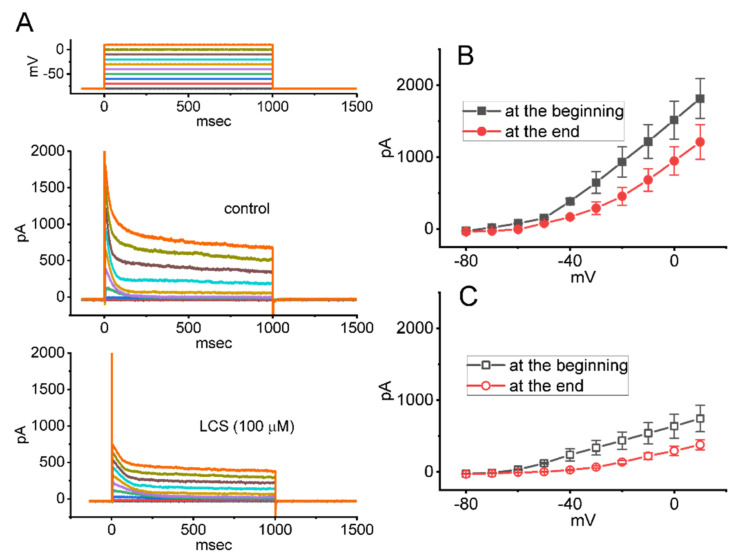
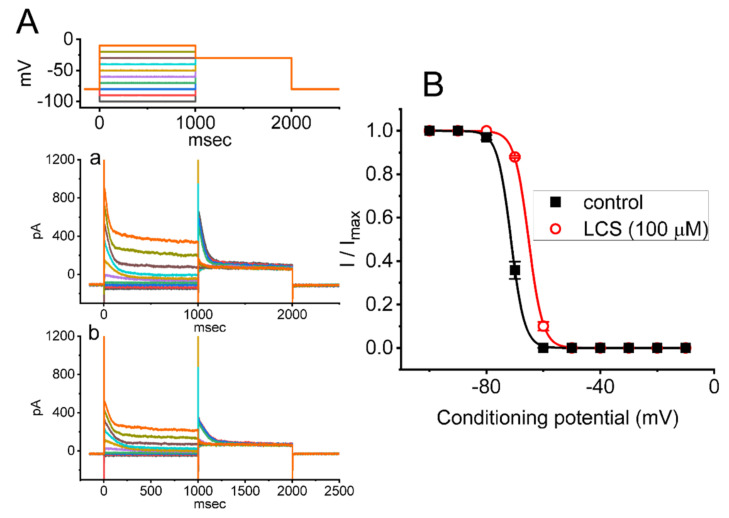
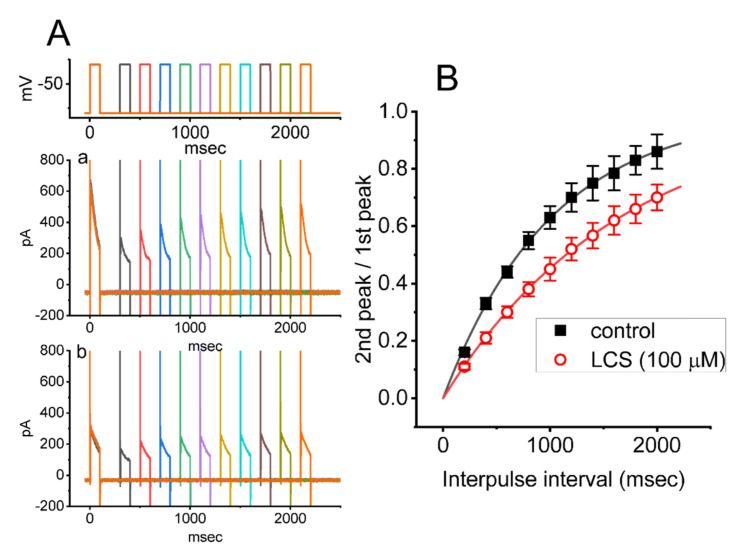
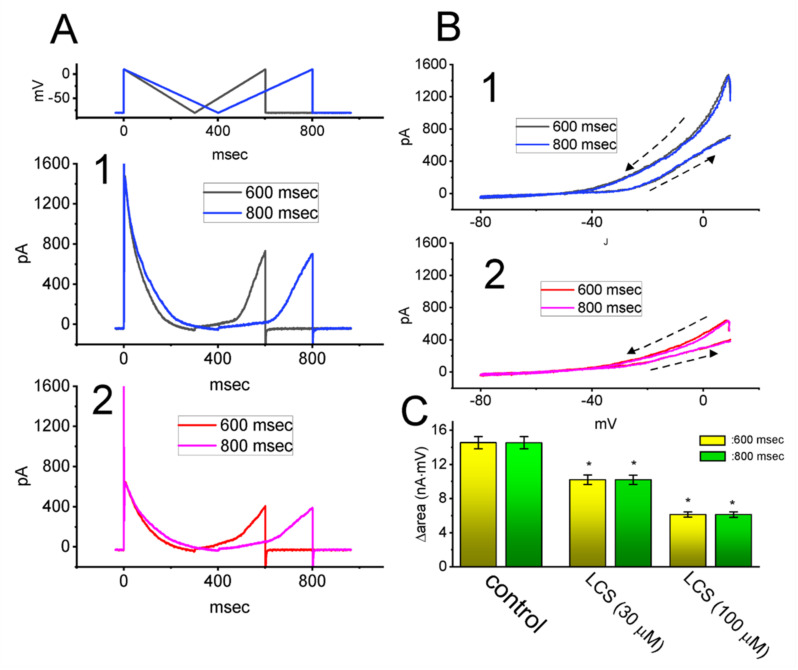
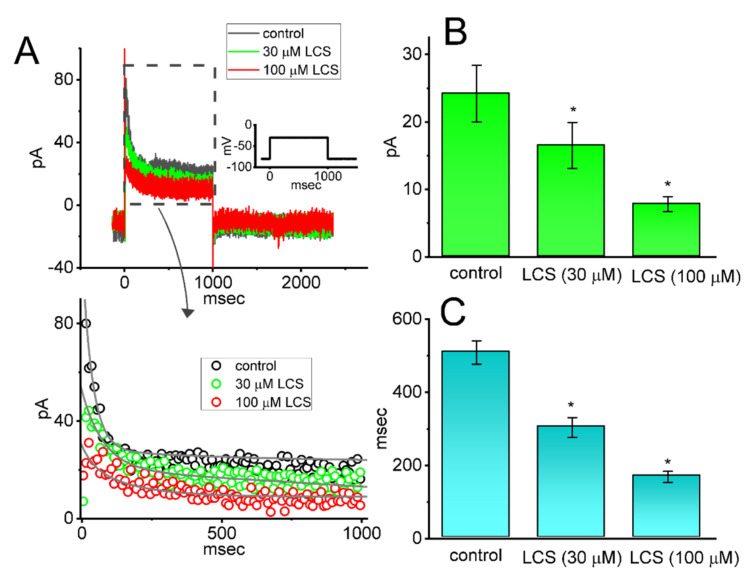
Lacosamide (Vimpat®, LCS) is widely known as a functionalized amino acid with promising anti-convulsant properties; however, adverse events during its use have gradually appeared. Despite its inhibitory effect on voltage-gated Na+ current (INa), the modifications on varying types of ionic currents caused by this drug remain largely unexplored. In pituitary tumor (GH3) cells, we found that the presence of LCS concentration-dependently decreased the amplitude of A-type K+ current (IK(A)) elicited in response to membrane depolarization. The IK(A) amplitude in these cells was sensitive to attenuation by the application of 4-aminopyridine, 4-aminopyridine-3-methanol, or capsaicin but not by that of tetraethylammonium chloride. The effective IC50 value required for its reduction in peak or sustained IK(A) was calculated to be 102 or 42 µM, respectively, while the value of the dissociation constant (KD) estimated from the slow component in IK(A) inactivation at varying LCS concentrations was 52 µM. By use of two-step voltage protocol, the presence of this drug resulted in a rightward shift in the steady-state inactivation curve of IK(A) as well as in a slowing in the recovery time course of the current block; however, no change in the gating charge of the inactivation curve was detected in its presence. Moreover, the LCS addition led to an attenuation in the degree of voltage-dependent hysteresis for IK(A) elicitation by long-duration triangular ramp voltage commands. Likewise, the IK(A) identified in mouse mHippoE-14 neurons was also sensitive to block by LCS, coincident with an elevation in the current inactivation rate. Collectively, apart from its canonical action on INa inhibition, LCS was effective at altering the amplitude, gating, and hysteresis of IK(A) in excitable cells. The modulatory actions on IK(A), caused by LCS, could interfere with the functional activities of electrically excitable cells (e.g., pituitary tumor cells or hippocampal neurons).

Keywords: A-type K+ current; current kinetics; hippocampal neuron; lacosamide (Vimpat®); pituitary cell; voltage hysteresis.


Conflict of interest statement

The authors declare no conflict of interest that is directly relevant to this study.

Figures

Figure 1
Figure 1
Effects of LCS on the magnitude of IK(A) in GH3 pituitary tumor cells. These experiments were made in cells that were bathed in Ca2+−free, Tyrode’s solution containing 1 μM tetrodotoxin (TTX) and 0.5 mM CdCl2, and we backfilled the recording electrode by using a K+−containing (145 mM) solution. (A) Representative IK(A) traces obtained in the control (black color) and during cell exposure to 10 μM LCS (brown color) or 100 μM LCS (red color). The uppermost part denotes the voltage−clamp protocol used. (B) Current traces showing an expanded record from those in (A); their trajectories were fitted by a two exponential (smooth gray line). Data points (indicated in open circles) were taken with or without the addition of LCS (10 or 100 μM). (C) Kinetic estimate in LCS−mediated block of IK(A) in GH3 cells (mean ± SEM; n = 8 for each point). The reciprocal of the slow component in the inactivation time constant (1/τinact(S)) of IK(A) derived from the exponential fit of the IK(A) trajectory was collated and then linearly plotted against the LCS concentration (gray straight line). Forward (on, k+1*) or backward (off, k−1) rate constant for the binding scheme, derived from the slope and the ordinate axis of the interpolated line, was 0.0213 s−1μM−1 or 1.112 s−1, respectively; thereafter, the KD value (k−1/k+1* = 52.3 μM) was yielded. (D) Concentration-dependent relationship of LCS effect on peak (red open circles) or sustained (black filled squares) IK(A) activated by 1−sec membrane depolarization (mean ± SEM; n = 8 for each point). Current amplitude was measured at the beginning or end-pulse of each depolarizing step, from −80 to −30 mV, with a duration of 1 s. The sigmoidal curve (black or red line) represents the best fit to the Hill equation (detailed in Materials and Methods). The statistical analyses were conducted with ANOVA−2 for repeated measures, (p (factor 1, groups among data taken at different LCS concentrations) < 0.05, p (factor 2, groups between the sustained and peak IK(A)) < 0.05, p (interaction) < 0.05, followed by post-hoc Fisher’s least−significance difference test, p < 0.05).
Figure 2
Figure 2
Effect of LCS, tetraethylammonium chloride (TEA), 4-aminopyridine-3-methanol (4-AP-3-MeOH), 4-aminopyridine (4-AP), or capsaicin (Cap) on the peak amplitude of IK(A) identified in GH3 cells. In these experiments, we bathed GH3 cells in Ca2+-free, Tyrode’s solution, and the recording electrode was filled with K+-enriched (145 mM) solution. Current amplitude was measured at the start of the depolarizing pulse, from −80 to −30 mV. Each bar represents the mean ± SEM (n = 8). Data analysis was performed by ANOVA-1 (p < 0.05). * Significantly different from control (p < 0.05).
Figure 3
Figure 3
Effect of LCS on the current versus voltage (I−V) relationship of IK(A) identified in GH3 cells. (A) Representative current traces obtained in the control period (i.e., LCS was not present, top panel) and during the exposure to 100 μM LCS (bottom panel). The uppermost part shows the voltage−clamp protocol applied. In (B,C), mean I−V relationships of peak or sustained IK(A) achieved in the absence (filled symbols) and presence (open symbols) of 100 μM LCS are respectively illustrated (mean ± SEM; n = 7 for each point). The amplitude of peak or sustained IK(A) was respectively measured at the beginning− or end−pulse of step depolarization from −80 to −30 mV with a duration of 1 s. The statistical analyses were made by ANOVA−2 for repeated measures, (p (factor 1, groups among data taken at different level of membrane potentials) < 0.05, p (factor 2, groups between the absence and presence of LCS) < 0.05, p (interaction) < 0.05, followed by post−hoc Fisher’s least−significance difference test, p < 0.05). Of notice, no change in the overall I−V relationship of peak or sustained IK(A) was detected in the presence of LCS, despite its reduction in the amplitude of peak or sustained IK(A).
Figure 4
Figure 4
Effect of LCS on the quasi−steady−state inactivation curve of IK(A) in GH3 cells. In this set of experiments, the conditioning voltage pulses with a duration of 1 s to a series of command voltage steps, ranging from −100 to −10 mV in 10−mV increments, were delivered to the examined cell from a holding potential of −80 mV. Following each conditioning pulse, a test pulse to −30 mV with a duration of 1 s was applied to evoke IK(A). (A) Representative current traces obtained in the absence (a) and presence (b) of 100 μM LCS. The voltage−clamp protocol is illustrated in the uppermost part. (B) Steady-state inactivation curve of IK(A) achieved in the absence (■) and presence (○) of 100 μM LCS (mean ± SEM; n = 7 for each point). The smooth curves were well fitted by the modified Boltzmann equation, as defined in Materials and Methods. The statistical analyses were made by ANOVA−2 for repeated measures, (p (factor 1, groups among data taken at the conditioning voltage levels) < 0.05, p (factor 2, groups between the absence and presence of LCS) < 0.05, p (interaction) < 0.05, followed by post−hoc Fisher’s least−significance difference test, p < 0.05). Notice that the exposure to LCS shifts the midpoint of the inactivation curve along the voltage axis toward less hyperpolarized voltage (i.e., to the right); however, it is devoid of modifications in the gating charge of the curve in its presence.
Figure 5
Figure 5
LCS−induced prolongation in the recovery of the IK(A) block in GH3 cells. Cells were bathed in Ca2+−free, Tyrode’s solution, and we filled up the electrode with K+−containing solution. During the recordings, we applied another set of two-pulse voltage−clamp protocol to the examined cells. (A) Representative current traces, demonstrating current recovery from the block by use of two−step voltage protocol with varying inter−pulse intervals (as indicated in the uppermost part). a: control; b: in the presence of 100 μM LCS. The uppermost part shows the voltage−clamp protocol applied. (B) Time course of recovery from IK(A) inactivation taken in the control period (■) and during exposure to 100 μM LCS (○) (mean ± SEM; n = 8 for each point). The smooth line, with or without the addition of LCS, was well fitted by single exponential function. The statistical analyses were made by ANOVA−2 for repeated measures, (p (factor 1, groups among data taken at different inter-pulse interval) < 0.05, p (factor 2, groups between the absence and presence of LCS) < 0.05, p (interaction) < 0.05, followed by post−hoc Fisher’s least−significance difference test, p < 0.05).
Figure 6
Figure 6
Inhibitory effect of LCS on the voltage-dependent hysteresis (Vhys) of IK(A) activated by inverted isosceles−triangular ramp pulse in GH3 cells. In this set of whole−cell current recordings, the potential applied to the examined cell was maintained at −80 mV, and we then imposed an inverted isosceles−triangular ramp pulse with the duration of 600 or 800 ms (i.e., ramp speed of ±150 or ±112.5 mV/s) to activate IK(A) in response to descending (from +10 to −80 mV) and ascending (from −80 to +10 mV) ramp voltage−clamp commands. (A) Representative current traces obtained in the control period (A1) and during cell exposure to 100 μM LCS (A2). The uppermost part shows the voltage−clamp protocol applied. The black and blue colors in (A1) or red and pink colors in (A2) indicate the current traces obtained with the ramp duration of 600 and 800 ms, respectively. (B) Representative instantaneous I−V relationships of IK(A) in response to inverted isosceles−triangular ramp pulse with a duration of 600 ms (black color in (B1) or red color in (B2)) or 800 ms (blue color in (B1) or pink color in (B2)). In (B1) and (B2), the instantaneous I−V relationships of IK(A) are illustrated in the absence and presence of 100 μM LCS, respectively. The dashed arrow in (B1) and (B2) shows the direction of IK(A) trajectories in which time passes during current elicitation by the inverted isosceles−triangular ramp pulse with a duration of 600 or 800 ms. (C) Summary bar graph demonstrating effects of LCS (30 or 100 μM) on the hysteretic area (Δarea) of IK(A) activated by isosceles−triangular ramp pulse (mean ± SEM; n = 8 for each bar). The hysteretic area indicates the one under the curve activated during the descending and ascending ends of the triangular ramp pulse. Red or green bars respectively indicate the hysteretic areas taken in the duration of 600 or 800 ms. Data analysis was made by ANOVA−1 (p < 0.05). Of note, there was an evident occurrence of voltage−dependent hysteresis (Vhys) for IK(A) activated by triangular ramp pulse, and the presence of LCS was able to attenuate the hysteretic area of the current. * Significantly different from controls (p < 0.05).
Figure 7
Figure 7
Effect of LCS on IK(A) identified in mouse mHippoE−14 hippocampal neurons. Cells were bathed in Ca2+−free, Tyrode’s solution, and the recording electrode was filled with K+−enriched (145 mM) solution. (A) Representative current traces obtained in the absence (black color) and presence of 30 μM LCS (green color) or 100 μM LCS (red color). The inset denotes the voltage−clamp protocol given. The bottom panel shows an expanded record from the dashed box in the top panel. The data points (open circles) in each current trajectory were reduced by 50 for better illustration. The current trajectory was fitted with the goodness of fits by a two−exponential function (indicated by gray smooth line). In (B) or (C), the summary bar graph depicts the LCS effect on the sustained IK(A) amplitude or τinact(S) value of IK(A) inactivation, respectively (mean ± SEM; n = 8). Current amplitude was activated by membrane depolarization from −80 to −30 mV with a duration of 1 s, and each current trajectory was fitted by a two−exponential function. Statistical analyses in (B,C) were made by ANOVA−1 (p < 0.05). * Significantly different from controls (p < 0.05).

Similar articles

Cited by

References

    1. Doty P., Rudd G.D., Stoehr T., Thomas D. Lacosamide. Neurotherapeutics. 2007;4:145–148. doi: 10.1016/j.nurt.2006.10.002. - DOI - PMC - PubMed
    1. Harris J.A., Murphy J.A. Lacosamide and epilepsy. CNS Neurosci. Ther. 2011;17:678–682. doi: 10.1111/j.1755-5949.2010.00198.x. - DOI - PMC - PubMed
    1. Strzelczyk A., Zöllner J.P., Willems L.M., Jost J., Paule E., Schubert-Bast S., Rosenow F., Bauer S. Lacosamide in status epilepticus: Systematic review of current evidence. Epilepsia. 2017;58:933–950. doi: 10.1111/epi.13716. - DOI - PubMed
    1. Hoy S.M. Lacosamide: A Review in Focal-Onset Seizures in Patients with Epilepsy. CNS Drugs. 2018;32:473–484. doi: 10.1007/s40263-018-0523-7. - DOI - PubMed
    1. Ortiz de la Rosa J.S., Ladino L.D., Rodríguez P.J., Rueda M.C., Polanía J.P., Castañeda A.C. Efficacy of lacosamide in children and adolescents with drug-resistant epilepsy and refractory status epilepticus: A systematic review. Seizure. 2018;56:34–40. doi: 10.1016/j.seizure.2018.01.014. - DOI - PubMed