. 2022 Jan 21;23(3):1180.
doi: 10.3390/ijms23031180.

Amino Acids and IGF1 Regulation of Fish Muscle Growth Revealed by Transcriptome and microRNAome Integrative Analyses of Pacu (Piaractus mesopotamicus) Myotubes

Affiliations

Amino Acids and IGF1 Regulation of Fish Muscle Growth Revealed by Transcriptome and microRNAome Integrative Analyses of Pacu (Piaractus mesopotamicus) Myotubes

Bruno Oliveira Silva Duran et al. Int J Mol Sci. .

Abstract

Amino acids (AA) and IGF1 have been demonstrated to play essential roles in protein synthesis and fish muscle growth. The myoblast cell culture is useful for studying muscle regulation, and omics data have contributed enormously to understanding its molecular biology. However, to our knowledge, no study has performed the large-scale sequencing of fish-cultured muscle cells stimulated with pro-growth signals. In this work, we obtained the transcriptome and microRNAome of pacu (Piaractus mesopotamicus)-cultured myotubes treated with AA or IGF1. We identified 1228 and 534 genes differentially expressed by AA and IGF1. An enrichment analysis showed that AA treatment induced chromosomal changes, mitosis, and muscle differentiation, while IGF1 modulated IGF/PI3K signaling, metabolic alteration, and matrix structure. In addition, potential molecular markers were similarly modulated by both treatments. Muscle-miRNAs (miR-1, -133, -206 and -499) were up-regulated, especially in AA samples, and we identified molecular networks with omics integration. Two pairs of genes and miRNAs demonstrated a high-level relationship, and involvement in myogenesis and muscle growth: marcksb and miR-29b in AA, and mmp14b and miR-338-5p in IGF1. Our work helps to elucidate fish muscle physiology and metabolism, highlights potential molecular markers, and creates a perspective for improvements in aquaculture and in in vitro meat production.

Keywords: IGF1; amino acids; cell culture; muscle growth; omics.


Conflict of interest statement

The authors declare no conflict of interest. The funders had no role in the design of the study; in the collection, analyses, or interpretation of data; in the writing of the manuscript, or in the decision to publish the results.

Figures

Figure 1
Figure 1
Digital expression of fbxo32 and myog. Gene expression of fbxo32 (f-box protein 32) and myog (myogenin) in CTR, AA and IGF1 groups according to the differential expression analyses. Expression is shown as number of counts, and values represent means ± s.e.m. (n = 3 independent cell cultures). The fold-changes are shown in the graphs and asterisks indicate significant differences compared to CTR: **: p-adj < 0.01; ***: p-adj < 0.001.
Figure 2
Figure 2
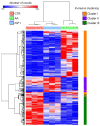
Transcriptome heatmap of pacu-cultured myotubes in CTR, AA, and IGF1 experimental groups. Heatmap showing gene expression according to the CTR, AA and IGF1 treatments by hierarchical clustering and non-hierarchical K-means clustering (K-means = 3). Heatmap shows the normalized read counts of differentially expressed genes, and one minus Pearson correlation was used as a metric for clustering.
Figure 3
Figure 3
Venn diagram of genes differentially expressed in AA and IGF1 pacu-cultured myotubes. The Venn diagram showing different sets of differentially expressed genes considering the AA and IGF1 treatments, with 218 deregulated genes by both experimental groups.
Figure 4
Figure 4
Gene ontology enrichment analysis of genes differently expressed in AA and IGF1 pacu-cultured myotubes. Biological processes were identified for up- and down-regulated genes in AA and IGF1 treatments compared to CTR group. Enrichment was defined as the 15 most significant terms according to the highest scores and p-values (<0.05).
Figure 5
Figure 5
Identification of marcksb as potential target of miR-29b in AA pacu-cultured myotubes. (A) Interaction molecular network between marcksb (myristoylated alanine rich protein kinase c substrate b), miR-29 and other differentially expressed genes and miRNAs. Up- and down-regulated genes are represented respectively by light red and light blue colors, and up- and down-regulated miRNAs are represented respectively by red and blue colors. Purple lines show interaction between miRNAs and genes, and black lines show interaction between the genes. (B) Bioinformatics prediction of the marcksb/miR-29b hybridization. The MFE (minimum free energy) value was within accepted range. (C) Gene expression of marcksb and ipu-miR-29b in CTR, AA and IGF1 groups according to the differential expression analyses. Expression is shown, as number of counts and values represents means ± s.e.m. (n = 3 independent cell cultures). The fold-changes in AA group are shown in the graphs, and asterisks indicate significant differences between groups: *: p-adj < 0.05; **: p-adj < 0.01; ***: p-adj < 0.001.
Figure 6
Figure 6
Identification of mmp14b as potential target of miR-338-5p in IGF1 pacu-cultured myotubes. (A) Interaction molecular network between mmp14b (matrix metallopeptidase 14b), miR-338 and other differentially expressed genes and miRNAs. Down-regulated genes are represented by light blue color, and up-regulated miRNAs are represented by red color. Purple lines show interaction between miRNAs and genes, and black lines show interaction between the genes. (B) Bioinformatics prediction of the mmp14b/miR-338-5p hybridization. The MFE (minimum free energy) value was within accepted range. (C) Gene expression of mmp14b and dre-miR-338-5p in CTR, AA and IGF1 groups according to the differential expression analyses. Expression is shown as number of counts, and values represent means ± s.e.m. (n = 3 independent cell cultures). The fold-changes in IGF1 group are shown in the graphs, and asterisks indicate significant differences between groups: *: p-adj < 0.05; ***: p-adj < 0.001.
Figure 7
Figure 7
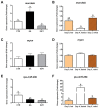
(A,C,E) In vitro and (B,D,F) in vivo relative expression of marcksb, mycn and miR-29b. Relative gene expression of marcksb (myristoylated alanine rich protein kinase C substrate b), mycn (n-myc proto-oncogene protein) and ipu-miR-29b by qPCR. Validation was performed from CTR, AA, and IGF1 myotubes (in vitro samples; n = 4 independent cell cultures), and from fish muscles before fasting (Day 0, fed), after 4 days of fasting (Day 4, fasted), and 3 days of re-feeding (Day 3, refed) (in vivo samples; n = 6). Values represent means ± s.e.m. Letters indicate significant differences between groups. Parametric data were analyzed by one-way ANOVA test, followed by Tukey’s multiple comparisons test, while non-parametric data were analyzed by a Kruskal–Wallis test, followed by Dunn’s multiple comparisons test (p < 0.05).
Figure 8
Figure 8
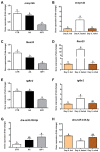
(A,C,E,G) In vitro and (B,D,F,H) in vivo relative expression of mmp14b, fbxo25, tgfbr2 and miR-338-5p. Relative gene expression of mmp14b (matrix metallopeptidase 14b), fbxo25 (f-box protein 25), tgfbr2 (tgf-beta receptor type-2) and dre-miR-338-5p by qPCR. Validation was performed from CTR, AA and IGF1 myotubes (in vitro samples; n = 4 independent cell cultures), and from fish muscles before fasting (Day 0, fed), after 4 days of fasting (Day 4, fasted), and 3 days of re-feeding (Day 3, refed) (in vivo samples; n = 6). Values represent means ± s.e.m. Letters indicate significant differences between groups. Parametric data was analyzed by one-way ANOVA test, followed by Tukey’s multiple comparisons test, while non-parametric data were analyzed by the Kruskal–Wallis test, followed by Dunn’s multiple comparisons test (p < 0.05).

References

    1. Johnston I.A. Genetic and Environmental Determinants of Muscle Growth Patterns. In: Johnston I.A., editor. Muscle Development and Growth. Academic Press; Cambridge, MA, USA: 2001. pp. 141–186.
    1. Sänger A.M., Stoiber W. Muscle fiber diversity and plasticity. In: Johnston I.A., editor. Muscle Development and Growth. Academic Press; Cambridge, MA, USA: 2001. pp. 187–250. Fish Physiology.
    1. Johnston I.A. Environment and plasticity of myogenesis in teleost fish. J. Exp. Biol. 2006;209:2249–2264. doi: 10.1242/jeb.02153. - DOI - PubMed
    1. Sandri M. Signaling in Muscle Atrophy and Hypertrophy. Physiology. 2008;23:160–170. doi: 10.1152/physiol.00041.2007. - DOI - PubMed
    1. Bonaldo P., Sandri M. Cellular and molecular mechanisms of muscle atrophy. Dis. Model. Mech. 2013;6:25–39. doi: 10.1242/dmm.010389. - DOI - PMC - PubMed

MeSH terms