. 2022 Jan 24;23(3):1285.
doi: 10.3390/ijms23031285.

Exosomal miRNAs from Prostate Cancer Impair Osteoblast Function in Mice

Affiliations

Exosomal miRNAs from Prostate Cancer Impair Osteoblast Function in Mice

Giulia Furesi et al. Int J Mol Sci. .

Abstract

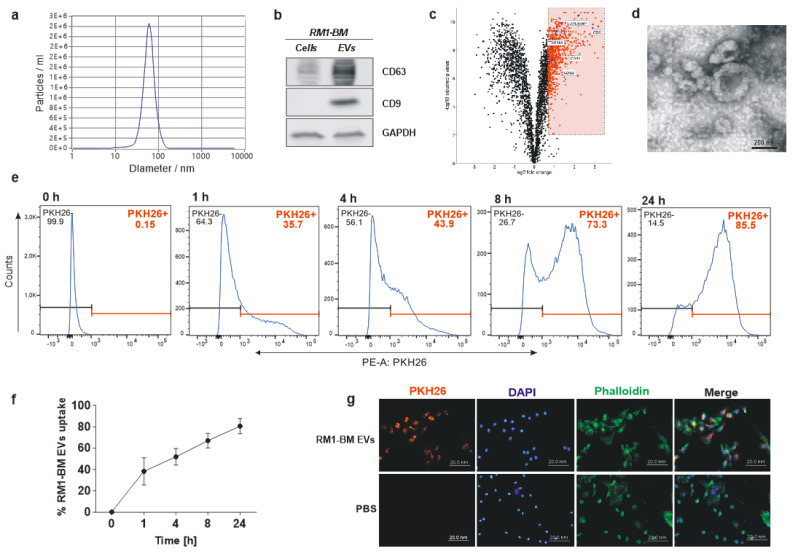
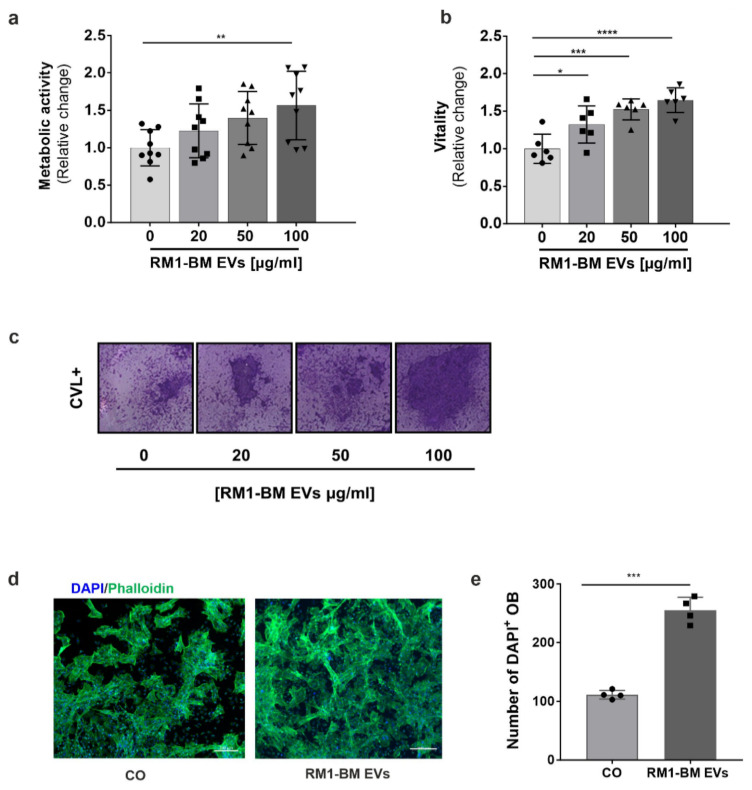
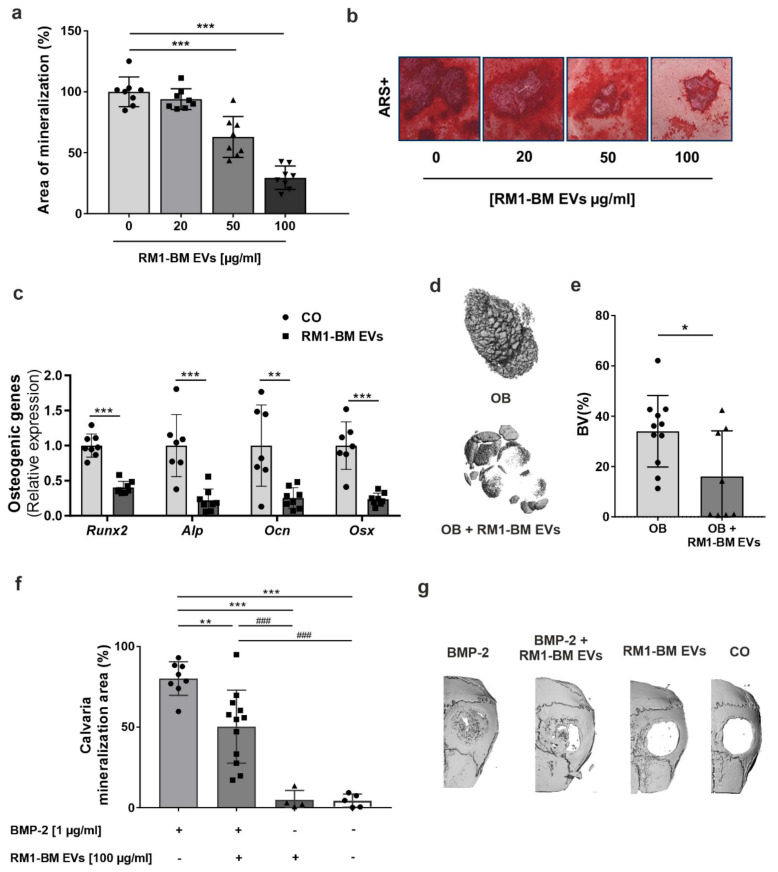
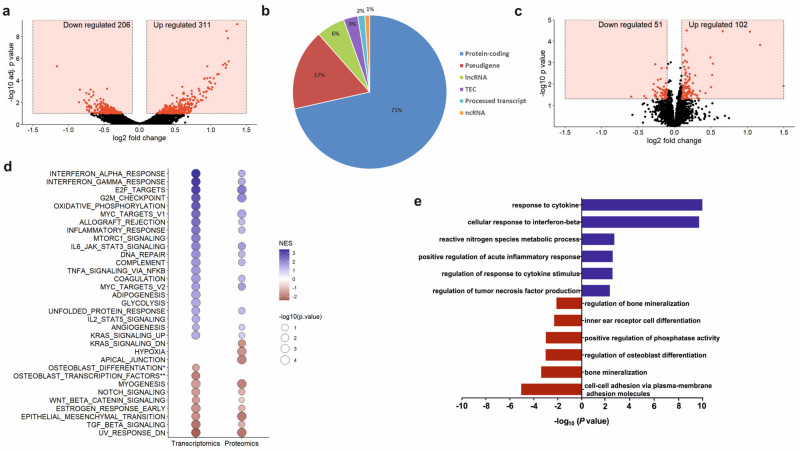
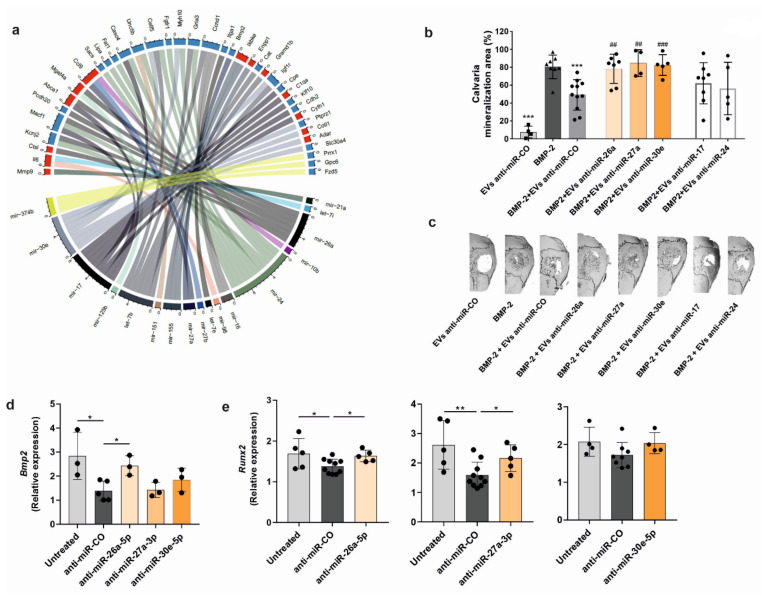
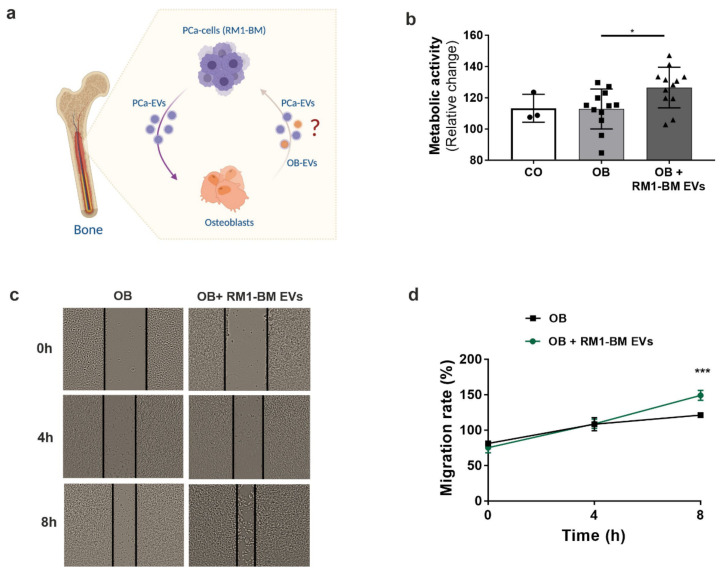
Prostate cancer (PCa) is the most frequent malignancy in older men with a high propensity for bone metastases. Characteristically, PCa causes osteosclerotic lesions as a result of disrupted bone remodeling. Extracellular vesicles (EVs) participate in PCa progression by conditioning the pre-metastatic niche. However, how EVs mediate the cross-talk between PCa cells and osteoprogenitors in the bone microenvironment remains poorly understood. We found that EVs derived from murine PCa cell line RM1-BM increased metabolic activity, vitality, and cell proliferation of osteoblast precursors by >60%, while significantly impairing mineral deposition (-37%). The latter was further confirmed in two complementary in vivo models of ossification. Accordingly, gene and protein set enrichments of osteoprogenitors exposed to EVs displayed significant downregulation of osteogenic markers and upregulation of proinflammatory factors. Additionally, transcriptomic profiling of PCa-EVs revealed the abundance of three microRNAs, miR-26a-5p, miR-27a-3p, and miR-30e-5p involved in the suppression of BMP-2-induced osteogenesis in vivo, suggesting the critical role of these EV-derived miRNAs in PCa-mediated suppression of osteoblast activity. Taken together, our results indicate the importance of EV cargo in cancer-bone cross-talk in vitro and in vivo and suggest that exosomal miRNAs may contribute to the onset of osteosclerotic bone lesions in PCa.

Keywords: bone metastases; extracellular vesicles; miRNA; osteoprogenitors; prostate cancer.


Conflict of interest statement

The authors declare the following financial interest/personal relationships which may be considered as potential competing interest: A.M.d.J.D. is employed by Dewpoint Therapeutics; M.H. is co-founder and share-holder of TAmiRNA GmbH (Vienna, Austria). All the other authors have no competing financial interest or personal relationships that could have appeared to influence the work reported in this paper.

Figures

Figure 1
Figure 1
Characterization of RM1-BM EVs and integration into osteoblastic target cells. (a) Determination of size distribution and relative concentration of EVs using nanoparticle tracking analyzer (NTA). (b) Western blot analysis of CD9 and CD63 with extracts from RM1-BM cells and freshly isolated EVs. (c) Determination of EV-enriched proteins by proteomics represented as volcano plot of log2 fold change (x-axis) and statistical significance (y-axis) of protein abundances in RM1-BM-released EVs vs. RM1-BM cells. red = statistically enriched proteins and blue = Top 100 ExoCarta entries among enriched proteins. (d) Representative transmission electron microscopy image of PCa-derived EVs. Scale bar: 200 nm. (e) Flow cytometric analysis and (f) percentage of PKH26-labeled EV uptake by osteoprogenitors after 0, 1, 4, 8, and 24 h of exposure. Data are presented as mean ± SD. (g) Representative immunofluorescence images of seven-day differentiated osteoprogenitors with labeled RM1-BM EVs or EVs-free medium (CO) for 24 h. Labeled EVs (PKH26) = red; F-actin cytoskeleton (phalloidin) = green; nuclei (DAPI) = blue. Scale bars = 200 µm. Results are representative of four independent experiments.
Figure 2
Figure 2
RM1-BM EVs enhance osteoblastic activity. Seven-day differentiated osteoprogenitors were treated with increasing concentration of RM1-BM EVs for 48 h. (a) Osteoprogenitor metabolic activity was evaluated based on CellTiter Blue assay. (b) Crystal violet assay was performed to determine cellular vitality (a,b) n = 6–9). (c) Representative image of Crystal violet staining. (d) Representative fluorescence microscopy pictures of osteoblast precursors treated with 100 µg/mL of RM1-BM EVs for 48 h and stained with Phalloidin (F-actin = green) and DAPI (nuclei = blue). Scale bar: 200 µm. (e) Number of DAPI-stained osteoprogenitor nuclei (n = 4). Statistical analyses were performed by one-way ANOVA with Tukey’s post hoc test (a,b) or unpaired Student’s t-test (e). Data are presented as mean ± SD. Statistical significance is denoted: * p < 0.05; ** p < 0.01; *** p < 0.001; **** p < 0.0001 vs. untreated cells. Circles: control, squares: 20 µg/ml RM1-BM EVs, triangle: 50 µg/ml RM1-BM EVs, inverse triangle: 100 µg/ml RM1-BM EVs.
Figure 3
Figure 3
RM1-BM EVs impair osteoblast differentiation and mineralization. (a) Quantification of the Alizarin Red S staining of bone marrow stromal cell-derived osteoblasts treated for 10 days with increasing concentration of RM1-BM EVs. Untreated cells were used as control (n = 8). Circles: control, squares: 20 µg/ml RM1-BM EVs, triangle: 50 µg/ml RM1-BM EVs, inverse triangle: 100 µg/ml RM1-BM EVs. (b) Representative image of Alizarin Red staining. (c) qPCR analysis of osteoblast markers in osteoprogenitors after 48 h of treatment with 100 μg/mL RM1-BM EVs (n = 7–8). Circles: control, squares: 20 µg/ml RM1-BM EVs. (d) Representative 3D pictures and (e) quantification of bone volume by micro-computed tomography (μCT) analysis of ectopic ossification in alginate beads (n = 8–11). Circles: control, triangle: 50 µg/ml RM1-BM EVs. (f) Quantitative analyses of newly-formed bone after 21 days of sponges implantation (n = 4–13). Circles in grey bar: BMP-2, squares: BMP2+RM1-BM EVs, triangle: RM1-BM EVs, circles in white bar: control. (g) Three-dimensional (3D) μCT pictures of bone formation at the critical-sized calvarial defects. Statistical analysis was performed by one-way ANOVA with Tukey’s post hoc test (a,f) or unpaired Student’s t-test (c,d). Data are presented as mean ± SD. Statistical significance is denoted: * p < 0.05; ** p < 0.01; *** p < 0.001 vs. untreated cells (a,c,e); ** p < 0.01; *** p < 0.001 vs. BMP-2 treated group and ### p < 0.001 vs. BMP-2+ PCa-EVs treated group (f).
Figure 4
Figure 4
RM1-BM EVs affect the osteoprogenitor transcriptome and proteome. (a) Determination of differentially expressed genes (DEGs) represented as volcano plot of log2 fold change (x-axis) and statistical significance (y-axis) of PCa-EV treated vs. untreated osteoprogenitors. Red = DEGs. (b) Pie chart of the distribution (expressed in percentage) of detected genes into six summarized transcript types: protein-coding, pseudogenes, long-non coding RNA (lncRNA), Tec family tyrosine kinases (TEC), processed transcript, and non-coding RNA (ncRNA). (c) Determination of DAPs represented as volcano plot of log2 fold change (x-axis) and statistical significance (y-axis) of PCa-EV treated vs. untreated osteoprogenitors. Red = DAPs. (d) GSEA of transcriptomic and proteomic enriched pathway. NES: normalized enrichment score; p-value (−log10). (e) Simplified graphical representation of overrepresented GO terms that are upregulated (blue) and under-regulated (red) in EV-treated osteoprogenitors vs. untreated controls. GO categories for each function were sorted based on the GO enrichment test p-value (−log10).
Figure 5
Figure 5
RM1-BM-derived miRNAs transferred via EVs impair bone formation and osteogenic differentiation. (a) Chord diagram showing the relationship between PCa-EVs miRNAs and osteoblast target genes. Larger segments indicate that one miRNA has many target genes (lower side) or that a gene is predicted to be a target of many miRNAs (upper side). Upregulated genes of EV-treated osteoblast precursors are colored in red, while the down-regulated genes are colored in blue. To create the plot, we considered only miRNAs with over 2000 reads per million (50 miRNAs) and osteoblastic genes with adjusted p-value < 0.05. (b) Quantitative analyses of newly-formed bone at the defect sites after 21 days of sponge implantation. Sponges were loaded with BMP-2, or EVs derived from PCa cells which were previously transfected with non-targeting anti-miR control (anti-miR-CO) or targeting anti-miRNA for miR-17, miR-24, miR-26a, miR-27a, and miR30e (n = 4–11). Squares: RM1-BM EVs with siCo, triangle: BMP-2, circles: BMP-2 with RM1-BM EVs with respective siRNAs. (c) 3D micro-computed tomography images of bone formation at the critical-sized calvarial defects. (d,e) Expression of the osteoblastic markers Bmp2 and Runx2 in osteoprogenitors treated with RM1-BM-EVs with anti-miR-CO or EVs deficient of miR-26a-5p, miR-27a-3p, or miR-30e-5p vs. untreated cells (n = 3–10). Circles indicate individual data points. Statistical analysis was performed by one-way ANOVA with Tukey’s post hoc test (b) or unpaired Student’s t-test (d,e). Data are presented as mean ± SD. Statistical significance is denoted: *** p < 0.001 vs. BMP-2 treated group and ## p < 0.01; ### p < 0.001 vs. BMP-2+ EVs anti-miR-CO group (b). * p < 0.05; ** p < 0.01 vs. controls (d,e).
Figure 6
Figure 6
Education of osteoprogenitors via RM1-BM-EVs promotes tumor cell metabolic activity and migration in vitro. (a) Schematic representation of the vicious cycle between osteoprogenitors and PCa cells mediated by EVs (image was created with BioRender.com). (b) RM1-BM metabolic activity was evaluated based on CellTiter Blue assay comparing untreated tumor cells (CO), cells treated with supernatant from unconditioned osteoprogenitors (OB), or cells treated with supernatant from EVs-conditioned osteoprogenitors (OB + RM1-BM EVs) (n = 3–12). Circles: control, squares: osteoblast supernatant, triangle: osteoblast supernatant with RM1-BM EVs. (c) Representative bright-field images (20×) of the scratch assay of RM1-BM cells treated with supernatant from unconditioned osteoprogenitors or EVs-conditioned osteoprogenitors after 0, 4, and 8 h. (d) Quantification of migration of RM1-BM cells indicated as percentages of scratch closure and calculated as follows: % of scratch closure = x−y/x, where (x) is a distance between edges of the wound, and (y) is the distance which remained cell-free during cell migration. Results are representative of more than three independently executed experiments. Statistical analysis was performed by one-way ANOVA with Tukey’s post hoc test (b) or unpaired Student’s t-test (d). Data are presented as mean ± SD. Statistical significance is denoted: * p < 0.05; *** p < 0.001vs RM1-BM cells treated with EVs-free osteoblast supernatant.

Similar articles

Cited by

References

    1. Bray F., Ferlay J., Soerjomataram I., Siegel R.L., Torre L.A., Jemal A. Global Cancer Statistics 2018: GLOBOCAN Estimates of Incidence and Mortality Worldwide for 36 Cancers in 185 Countries. CA A Cancer J. Clin. 2018;68:394–424. doi: 10.3322/caac.21492. - DOI - PubMed
    1. Koo K.C., Park S.U., Kim K.H., Rha K.H., Hong S.J., Yang S.C., Chung B.H. Prognostic Impacts of Metastatic Site and Pain on Progression to Castrate Resistance and Mortality in Patients with Metastatic Prostate Cancer. Yonsei Med. J. 2015;56:1206–1212. doi: 10.3349/ymj.2015.56.5.1206. - DOI - PMC - PubMed
    1. Hall C.L., Bafico A., Dai J., Aaronson S.A., Keller E.T. Prostate Cancer Cells Promote Osteoblastic Bone Metastases through Wnts. Cancer Res. 2005;65:7554–7560. doi: 10.1158/0008-5472.CAN-05-1317. - DOI - PubMed
    1. Patel L.R., Camacho D.F., Shiozawa Y., Pienta K.J., Taichman R.S. Mechanisms of Cancer Cell Metastasis to the Bone: A Multistep Process. Future Oncol. 2011;7:1285–1297. doi: 10.2217/fon.11.112. - DOI - PMC - PubMed
    1. Paget S. The Distribution of Secondary Growths in Cancer Of The Breast. Lancet. 1889;133:571–573. doi: 10.1016/S0140-6736(00)49915-0. - DOI - PubMed

MeSH terms

Substances