

Enhanced Ca2+ Entry Sustains the Activation of Akt in Glucose Deprived SH-SY5Y Cells
- PMID: 35163310
- PMCID: PMC8835965
- DOI: 10.3390/ijms23031386
Enhanced Ca2+ Entry Sustains the Activation of Akt in Glucose Deprived SH-SY5Y Cells
Abstract
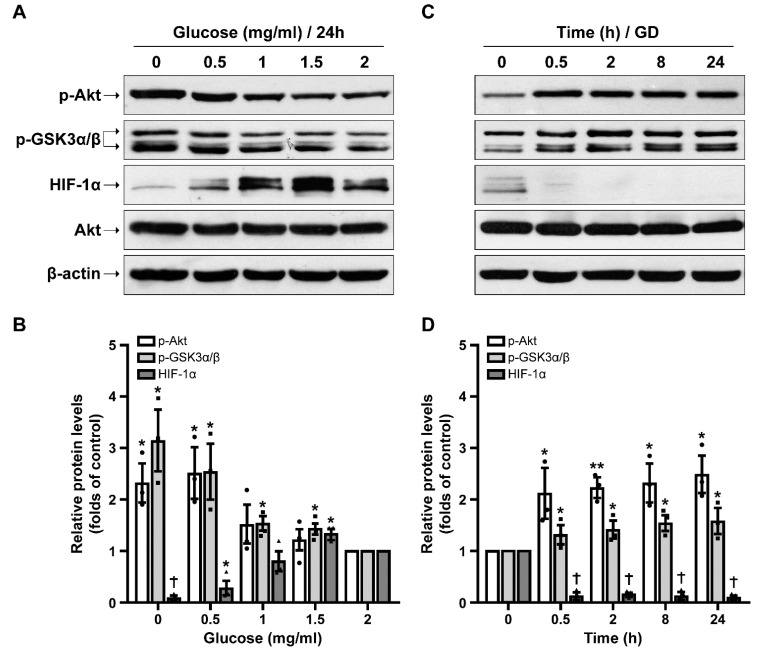
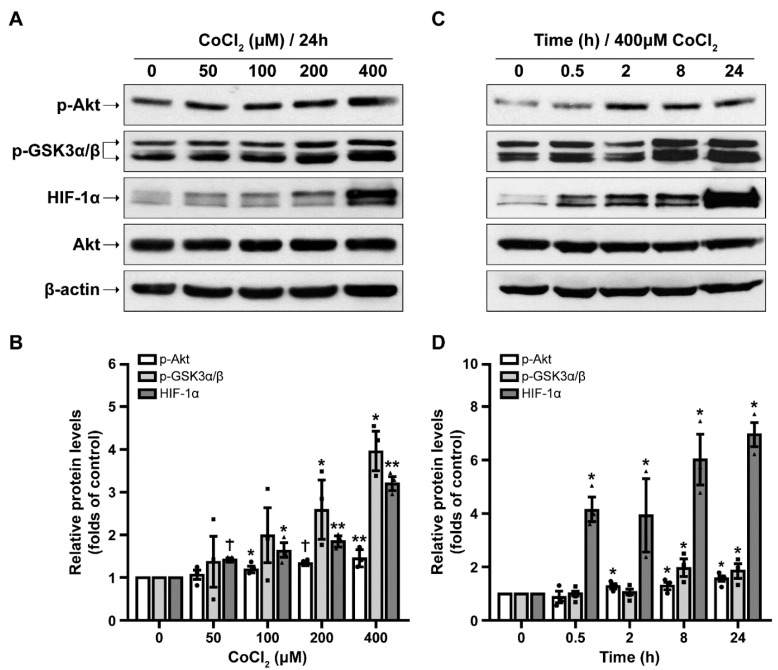
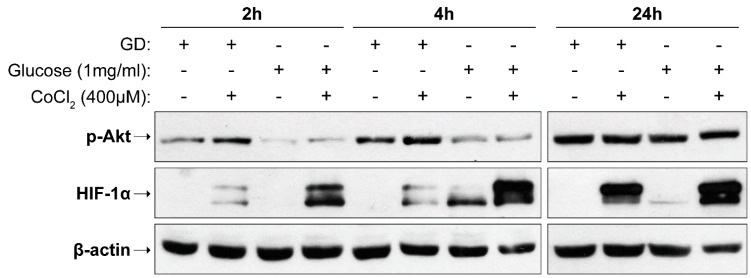
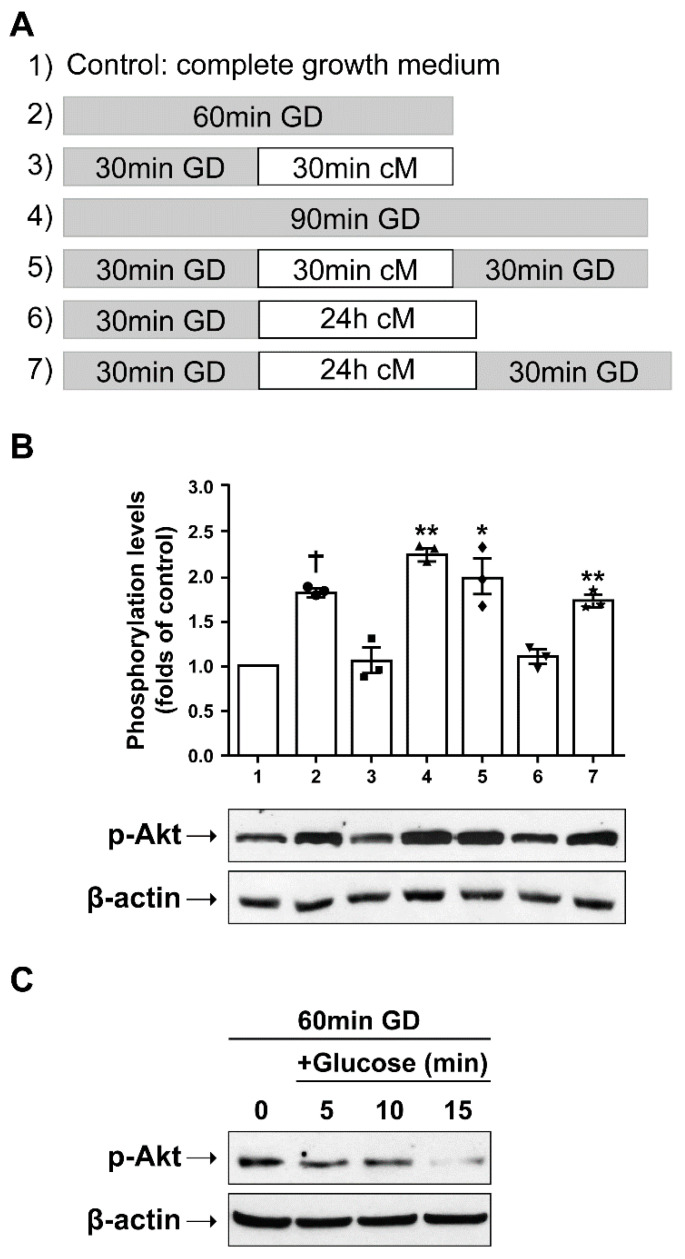
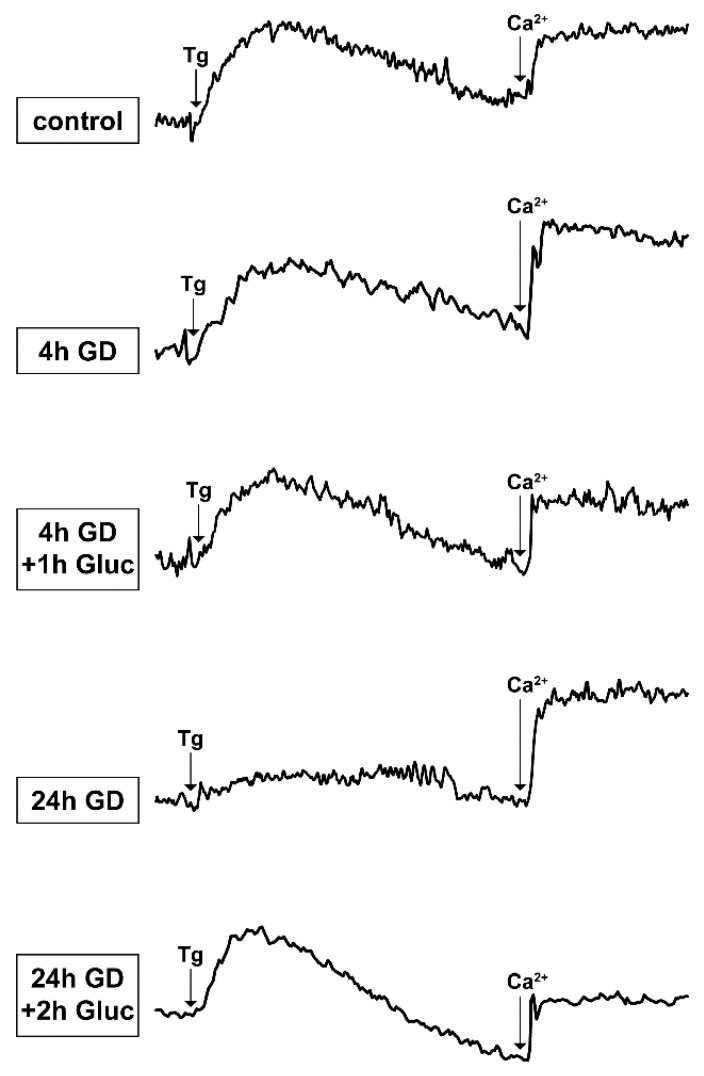
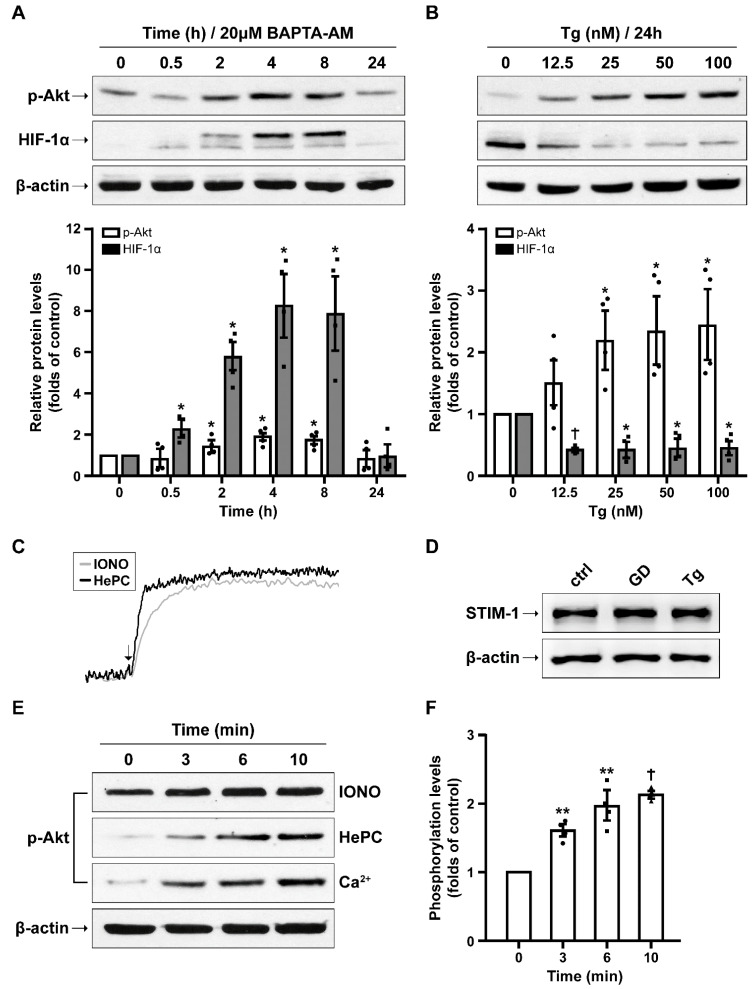
The two crucial cellular insults that take place during cerebral ischemia are the loss of oxygen and loss of glucose, which can both activate a cascade of events leading to neuronal death. In addition, the toxic overactivation of neuronal excitatory receptors, leading to Ca2+ overload, may contribute to ischemic neuronal injury. Brain ischemia can be simulated in vitro by oxygen/glucose deprivation, which can be reversible by the re-establishment of physiological conditions. Accordingly, we examined the effects of glucose deprivation on the PI3K/Akt survival signaling pathway and its crosstalk with HIF-1α and Ca2+ homeostasis in SH-SY5Y human neuroblastoma cells. It was found that glucose withdrawal decreased HIF-1α protein levels even in the presence of the ischemia-mimicking CoCl2. On the contrary, and despite neuronal death, we identified a strong activation of the master pro-survival kinase Akt, a finding that was also confirmed by the increased phosphorylation of GSK3, a direct target of p-Akt. Remarkably, the elevated Ca2+ influx recorded was found to promptly trigger the activation of Akt, while a re-addition of glucose resulted in rapid restoration of both Ca2+ entry and p-Akt levels, highlighting the plasticity of neurons to respond to ischemic challenges and the important role of glucose homeostasis for multiple neurological disorders.
Keywords: Akt kinase; Ca2+ entry; glucose deprivation; hypoxia; hypoxia-inducible factor 1; ischemia.
Conflict of interest statement
The authors declare no conflict of interest.
Figures
Similar articles
-
Somatostatin receptor sst2 reduces Akt activity and aggravates hypoxic/ischemic death in cerebral cortical neurons.Neuropharmacology. 2014 Feb;77:249-56. doi: 10.1016/j.neuropharm.2013.10.011. Epub 2013 Oct 21. Neuropharmacology. 2014. PMID: 24157493
-
Phosphatidylinositol-3-kinase/Akt/glycogen synthase kinase-3 beta and ERK1/2 pathways mediate protective effects of acylated and unacylated ghrelin against oxygen-glucose deprivation-induced apoptosis in primary rat cortical neuronal cells.J Endocrinol. 2008 Sep;198(3):511-21. doi: 10.1677/JOE-08-0160. Epub 2008 Jun 9. J Endocrinol. 2008. PMID: 18541646
-
Inhibition of autophagy via activation of PI3K/Akt pathway contributes to the protection of ginsenoside Rb1 against neuronal death caused by ischemic insults.Int J Mol Sci. 2014 Sep 1;15(9):15426-42. doi: 10.3390/ijms150915426. Int J Mol Sci. 2014. PMID: 25257523 Free PMC article.
-
n-3 Polyunsaturated Fatty Acids Reduce Neonatal Hypoxic/Ischemic Brain Injury by Promoting Phosphatidylserine Formation and Akt Signaling.Stroke. 2015 Oct;46(10):2943-50. doi: 10.1161/STROKEAHA.115.010815. Epub 2015 Sep 15. Stroke. 2015. PMID: 26374481
-
Neuronal Responses to Ischemia: Scoping Review of Insights from Human-Derived In Vitro Models.Cell Mol Neurobiol. 2023 Oct;43(7):3137-3160. doi: 10.1007/s10571-023-01368-y. Epub 2023 Jun 28. Cell Mol Neurobiol. 2023. PMID: 37380886 Free PMC article.
Cited by
-
Luteolin-7-O-β-d-glucuronide Ameliorates Cerebral Ischemic Injury: Involvement of RIP3/MLKL Signaling Pathway.Molecules. 2024 Apr 7;29(7):1665. doi: 10.3390/molecules29071665. Molecules. 2024. PMID: 38611943 Free PMC article.
-
Molecular Signaling in Stroke.Int J Mol Sci. 2023 Mar 22;24(6):5975. doi: 10.3390/ijms24065975. Int J Mol Sci. 2023. PMID: 36983049 Free PMC article.
-
Transplantation of dorsal root ganglia overexpressing the NaChBac sodium channel improves locomotion after complete SCI.Mol Ther. 2024 Jun 5;32(6):1739-1759. doi: 10.1016/j.ymthe.2024.03.038. Epub 2024 Mar 30. Mol Ther. 2024. PMID: 38556794 Free PMC article.
-
Excitatory Synaptic Transmission in Ischemic Stroke: A New Outlet for Classical Neuroprotective Strategies.Int J Mol Sci. 2022 Aug 19;23(16):9381. doi: 10.3390/ijms23169381. Int J Mol Sci. 2022. PMID: 36012647 Free PMC article. Review.
-
From HDAC to Voltage-Gated Ion Channels: What's Next? The Long Road of Antiepileptic Drugs Repositioning in Cancer.Cancers (Basel). 2022 Sep 10;14(18):4401. doi: 10.3390/cancers14184401. Cancers (Basel). 2022. PMID: 36139561 Free PMC article. Review.
References
-
- Béjot Y., Garnier P. Hormesis in Health and Disease. CRC Press; Boca Raton, FL, USA: 2014. Cerebral Ischemia. - DOI
MeSH terms
Substances
LinkOut - more resources
Full Text Sources
Miscellaneous
