. 2022 Jan 26;23(3):1417.
doi: 10.3390/ijms23031417.

The CAR-mRNA Interaction Surface Is a Zipper Extension of the Ribosome A Site

Affiliations

The CAR-mRNA Interaction Surface Is a Zipper Extension of the Ribosome A Site

Carol Dalgarno et al. Int J Mol Sci. .

Abstract

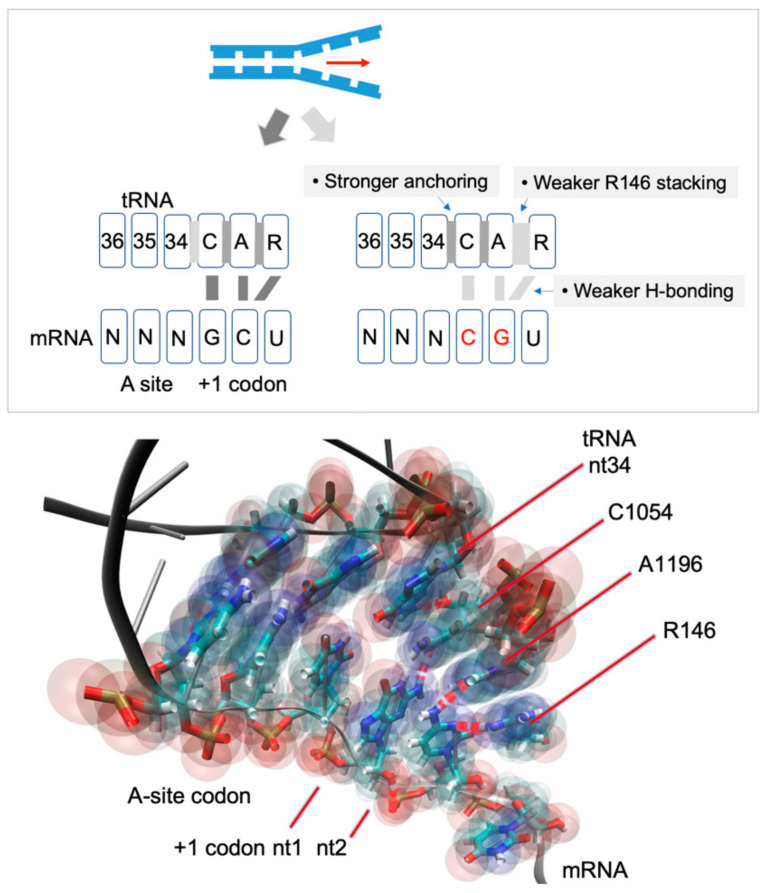
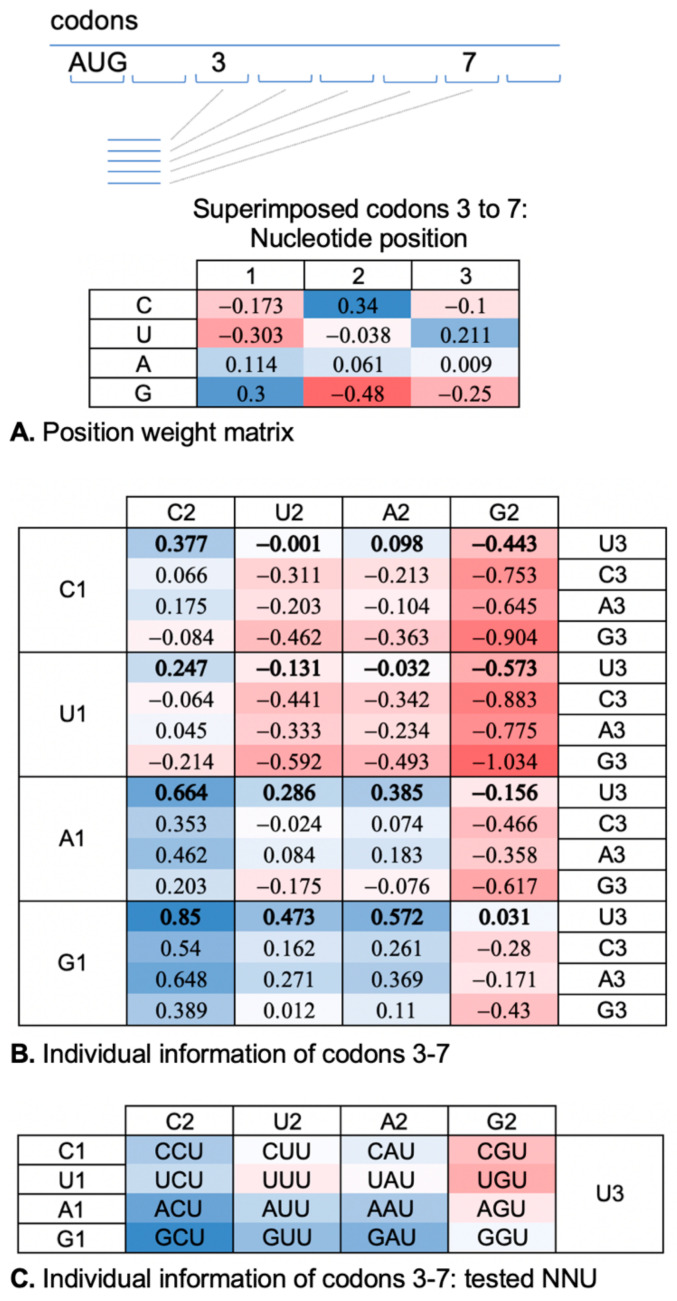
The ribosome CAR interaction surface behaves as an extension of the decoding center A site and has H-bond interactions with the +1 codon, which is next in line to enter the A site. Through molecular dynamic simulations, we investigated the codon sequence specificity of this CAR-mRNA interaction and discovered a strong preference for GCN codons, suggesting that there may be a sequence-dependent layer of translational regulation dependent on the CAR interaction surface. Dissection of the CAR-mRNA interaction through nucleotide substitution experiments showed that the first nucleotide of the +1 codon dominates over the second nucleotide position, consistent with an energetically favorable zipper-like activity that emanates from the A site through the CAR-mRNA interface. Moreover, the CAR/+1 codon interaction is affected by the identity of nucleotide 3 of +1 GCN codons, which influences the stacking of G and C. Clustering analysis suggests that the A-site decoding center adopts different neighborhood substates that depend on the identity of the +1 codon.

Keywords: A-site decoding center; CAR interaction surface; molecular dynamics; ribosome substates; ribosome translocation.


Conflict of interest statement

The authors declare no conflict of interest.

Figures

Figure 1
Figure 1
The ribosome CAR surface interacts with the mRNA +1 codon. The CAR surface is positioned close to the mRNA +1 codon allowing for H-bonding between CAR and the codon. Our study shows that this interaction is strongest with the +1 GCU codon. The weaker interaction with other +1 codons is associated with weaker stacking interactions between A1196 and R146, and stronger anchoring through stacking between C1054 and tRNA nt 34. The CAR/+1 codon interaction behaves like a zipper (red arrow; see text).
Figure 2
Figure 2
Information theoretic analysis of codons. (A) Codons 3–7 of ORFs of 6033 yeast genes were superimposed to create a meta-codon representation. The position weight matrix shows log2(fobserved/fexpected) for nucleotides at each codon position based on expected background frequencies in ORFs (A: 0.328, C: 0.192, G: 0.204, U: 0.276). (B) Individual information scores for codons were calculated using the position weight matrix. For example, the score for GCU is 0.30 + 0.34 + 0.21 = 0.85. (C) NNU codons were analyzed in this study with a heatmap color scale, indicating their relative individual information scores.
Figure 3
Figure 3
H-bond interactions of CAR. (A) Illustrated are H-bond counts between mRNA nucleotides (in the A site and +1 codon next to enter the A site) and the tRNA anticodon and ribosome CAR interface. Schematics show which pairs of residues are included in graphed H-bond averages. Statistical tests show comparisons with +1 GCU (p < 0.05 *; p < 0.01 **; p < 0.001 ***). Error bars show standard errors in H-bond counts from the MD. (B) Groupings of +1 codons with significantly different levels of H-bonding (t-test p < 0.001). In addition, +1 codons with G at position 1 (red arrows) or C at position 2 (blue arrows) have strong interactions. With U at position 1 (orange arrows), the H-bonding is split between C1054 and A1196 (see Figure 4).
Figure 4
Figure 4
Alignment of CAR–mRNA interactions. Nucleotide 1 of the +1 GCU codon has dominant H-bond interactions with C1054. In contrast, the weaker interactions of U at position 1 (+1 UNN) are split between C1054 (orange) and A1196 (grey). C or A at position 1 has weak interactions with tRNA nt 34 (blue), C1054, and A1196.
Figure 5
Figure 5
Influences of nucleotide positions on the CAR/+1 codon interaction. (A) When position 1 of the optimal +1 GCU codon is changed, both positions 1 and 2 of the codon have reduced H-bonding with CAR and tRNA nt34. (B) When position 2 of +1 GCU is changed, position 2 has significantly reduced H-bonding, but position 1 has minor reductions suggesting that the +1 codon interaction with CAR has zipper-like properties emanating from the A site. (C) When position 3 of +1 GCU is changed, the position 2 interaction with CAR is disrupted suggesting that position 3 may affect G1:C2 stacking. (D) A polar coordinate representation of G1:C2 stacking [32] across trajectories (1600 ns for each +1 codon) shows that G1:C2 stacking is less centered (smaller ρ-values) and more variable when U3 is replaced with A3, C3 or G3. Note that smaller ρ-values closer to the center have less area due to the polar coordinate projection onto a plane (see Figure S3).
Figure 6
Figure 6
CAR interactions correlate with +1 codon individual information scores. (A) Summed H-bond counts for positions 1 and 2 of +1 codons. (B) Comparison of these H-bond counts with individual information scores of +1 GNN and +1 CNN codons revealed a correlation (Spearman correlation coefficient = 0.818). (C) However, +1 ANN and +1 UNN codons show a negative correlation (Spearman correlation coefficient = −0.833).
Figure 7
Figure 7
CAR stacking depends on +1 codons. (A) Stacking interactions in the CAR structure were assessed by measuring the center of mass (COM) distances between the base rings of C1054 and A1196, and between A1196 and the guanidinium group heavy atoms of R146. CAR anchoring was assessed through the COM distance between C1054 and tRNA nt34. The optimal +1 GCU codon had the strongest A1196_R146 stacking and weakest nt34_C1054 anchoring. (B) RMSF of R146 was correspondingly lowest for +1 GCU. (C) Solvent accessible surface area (SASA) measurements comparing +1 GCU and +1 CGU codons similarly showed that +1 GCU has lower SASA for A1196_R146 reflecting its stronger stacking, and higher SASA for nt34_C1054 reflecting its weaker stacking. White circles or “x” indicate means. Statistical tests show comparisons with +1 GCU (p < 0.05 *; p < 0.01 **; p < 0.001 ***).
Figure 8
Figure 8
The decoding center adopts different backbone structures depending on +1 codons. (A) K-means clustering was performed on concatenated trajectories for +1 GCU and +1 CGU. Backbone atoms of the 321 unrestrained residues were used for clustering. Clustering with K = 5 revealed two dominant clusters, each populated by frames from only +1 GCU (cluster 1) or +1 CGU (cluster 2). In addition, 4.2% of +1 CGU frames were in other clusters. (B) K-means clustering was performed with all atoms of 12 residues (A-site codon and anticodon, +1 codon and CAR). Clustering with K = 2 revealed clusters dominated by +1 GCU or +1 CGU. The centroid frame structures are illustrated using van der Waals spheres for tRNA nt 34, C1054, A1196, and R146 (left to right). Cluster 1 (+1 GCU) shows weaker anchoring of CAR to tRNA nt 34, whereas the centroid for cluster 2 (+1 CGU) shows better CAR anchoring but poorer stacking of R146. The base rings of +1 codon nucleotides 1 and 2 are not illustrated and were not included in the clustering analysis. (C) Comparison of cluster 2 frames (CGU) with the centroid of cluster 1 (GCU, illustrated structure) from K-means analysis with backbone atoms (panel A) revealed extensive differences throughout the subsystem neighborhood (reds and yellows in structure heat map). As expected, the restrained onion shell residues show low RMSF values (blue).
Figure 9
Figure 9
Trajectories for six +1 codons were concatenated for K-means analysis (30 trajectories each, two frames/ns). (A) Clustering (K = 4) with backbone atoms of unrestrained residues grouped together (cluster 1) frames for +1 codons with high (GCU) or intermediate (CCU, GGU, UGU) H-bonding between CAR and the +1 codon. Frames for +1 codons with low CAR/+1 codon H-bonding (AAU and CGU) were grouped in the other cluster (cluster 2), along with very small fractions of the CCU and UGU frames. (B) Clustering (K = 2) performed with all atoms of 12 residues (A-site codon and anticodon, +1 codon and CAR) revealed a cluster (cluster 1) dominated by GCU, GGU. In addition, the centroid frame for this cluster has weak anchoring of CAR to tRNA nt 34. The other cluster (cluster 2) is dominated by AAU and CGU, and its centroid frame (CGU, not shown) has good anchoring of CAR but weaker stacking of Rps3 R146.

References

    1. Pavitt G.D. Regulation of translation initiation factor eIF2B at the hub of the integrated stress response. WIREs RNA. 2018;9:e1491. doi: 10.1002/wrna.1491. - DOI - PubMed
    1. Sanchez M., Lin Y., Yang C., McQuary P., Campos A.R., Blanc P.A., Wolf D.A. Cross Talk between eIF2a and eEF2 Phosphorylation Pathways Optimizes Translational Arrest in Response to Oxidative Stress. iScience. 2019;20:466–480. doi: 10.1016/j.isci.2019.09.031. - DOI - PMC - PubMed
    1. Shenton D., Smirnova J.B., Selley J.N., Carroll K., Hubbard S.J., Pavitt G.D., Ashe M.P., Grant C.M. Global Translational Responses to Oxidative Stress Impact upon Multiple Levels of Protein Synthesis. J. Biol. Chem. 2006;281:29011–29021. doi: 10.1074/jbc.M601545200. - DOI - PubMed
    1. Chan C.T., Dyavaiah M., DeMott M.S., Taghizadeh K., Dedon P.C., Begley T.J. A quantitative systems approach reveals dynamic control of tRNA modifications during cellular stress. PLoS Genet. 2010;6:e1001247. doi: 10.1371/journal.pgen.1001247. - DOI - PMC - PubMed
    1. Gu C., Begley T.J., Dedon P.C. tRNA modifications regulate translation during cellular stress. FEBS Lett. 2014;588:4287–4296. doi: 10.1016/j.febslet.2014.09.038. - DOI - PMC - PubMed

LinkOut - more resources