. 2022 Jan 26;23(3):1419.
doi: 10.3390/ijms23031419.

pH-Sensing G Protein-Coupled Receptor OGR1 (GPR68) Expression and Activation Increases in Intestinal Inflammation and Fibrosis

Affiliations

pH-Sensing G Protein-Coupled Receptor OGR1 (GPR68) Expression and Activation Increases in Intestinal Inflammation and Fibrosis

Cheryl de Vallière et al. Int J Mol Sci. .

Abstract

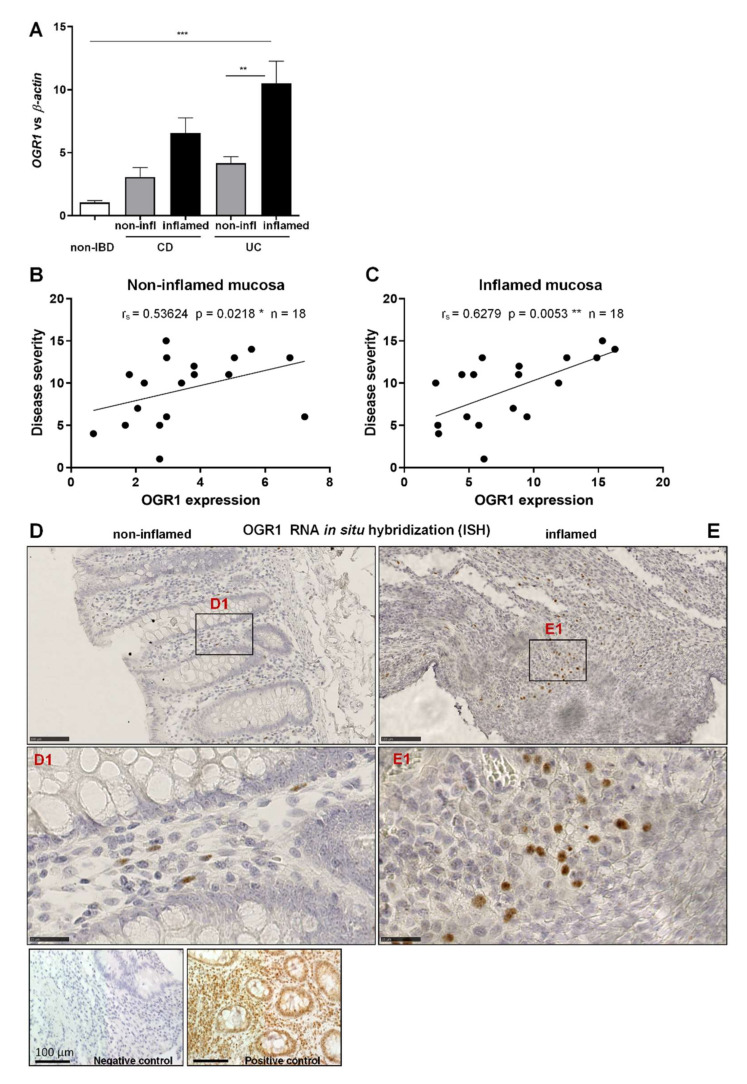
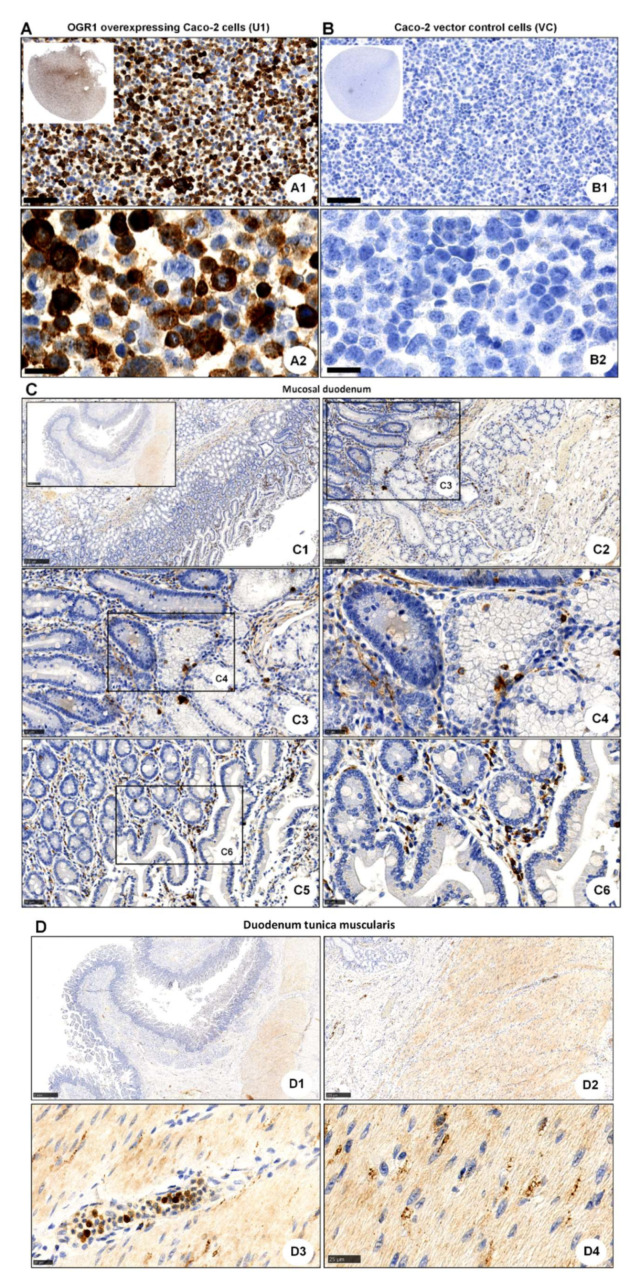
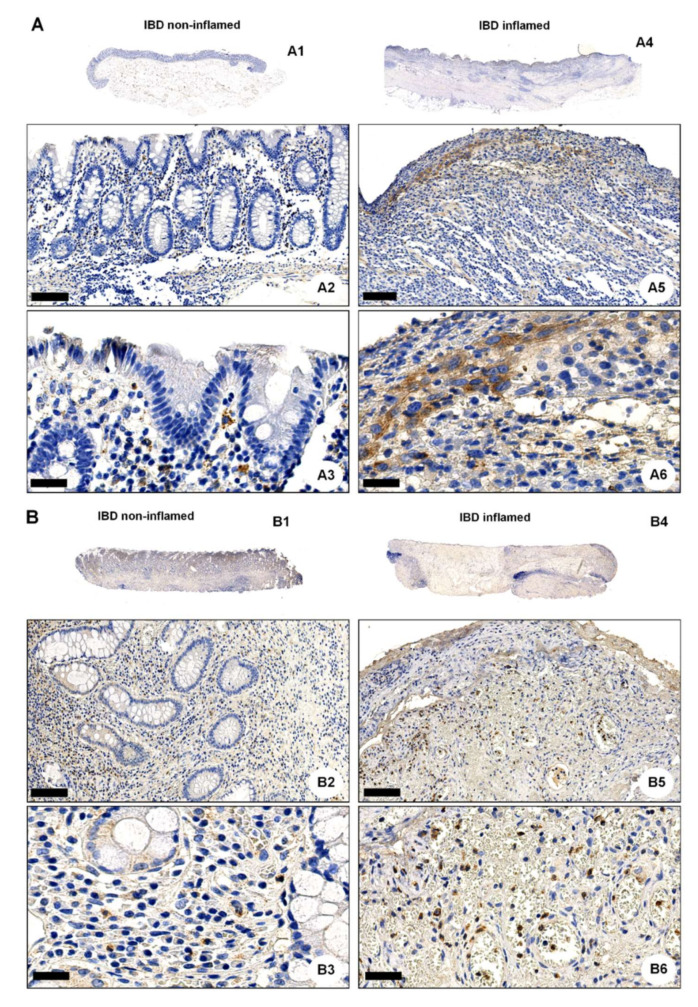
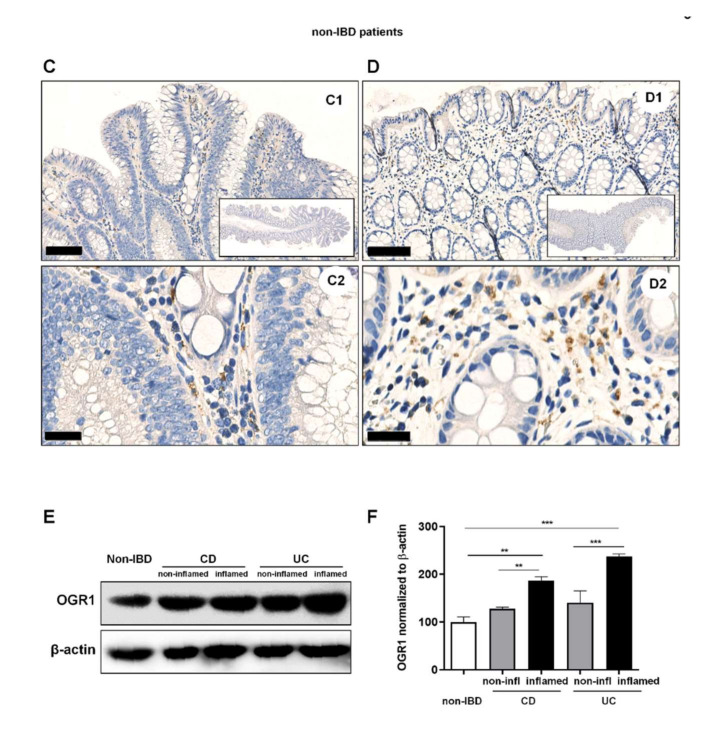
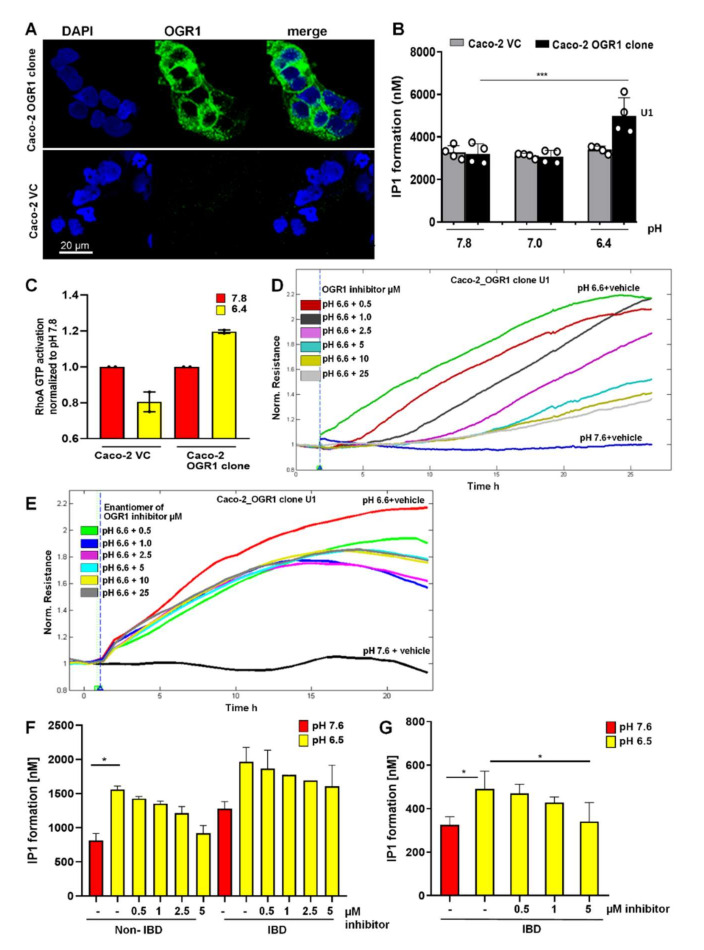
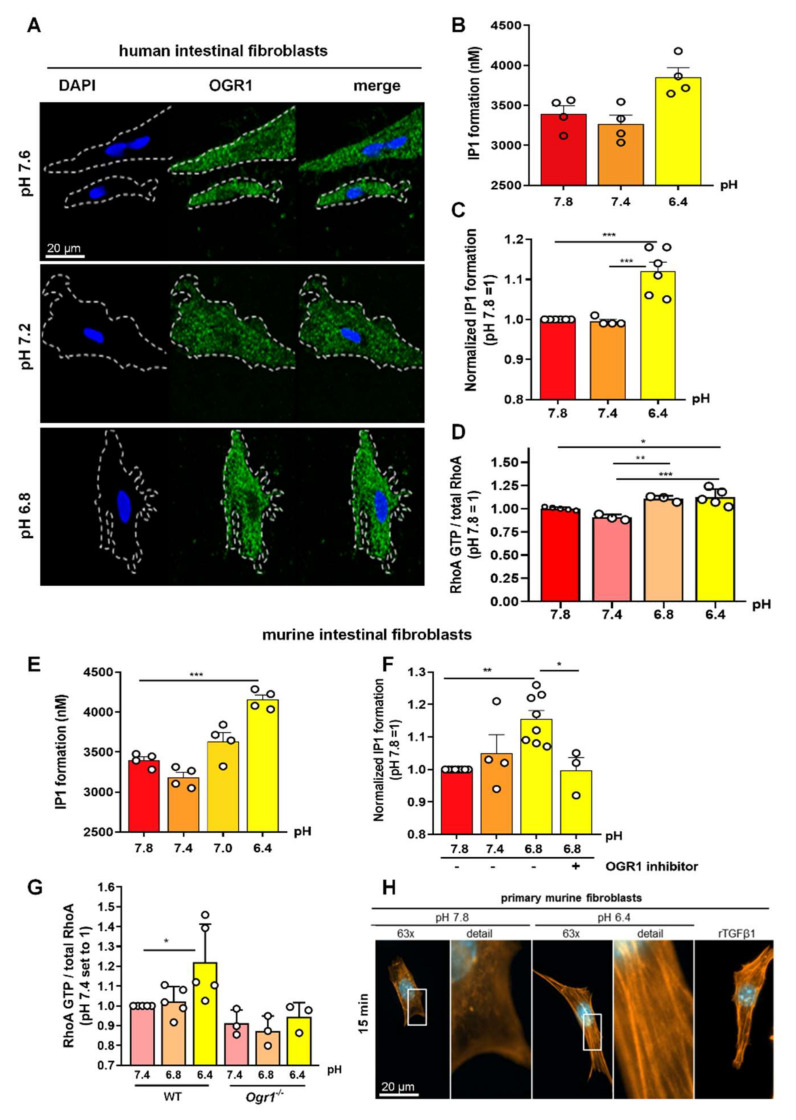
Local extracellular acidification occurs at sites of inflammation. Proton-sensing ovarian cancer G-protein-coupled receptor 1 (OGR1, also known as GPR68) responds to decreases in extracellular pH. Our previous studies show a role for OGR1 in the pathogenesis of mucosal inflammation, suggesting a link between tissue pH and immune responses. Additionally, pH-dependent signalling is associated with the progression of intestinal fibrosis. In this study, we aimed to investigate OGR1 expression and OGR1-mediated signalling in patients with inflammatory bowel disease (IBD). Our results show that OGR1 expression significantly increased in patients with IBD compared to non-IBD patients, as demonstrated by qPCR and immunohistochemistry (IHC). Paired samples from non-inflamed and inflamed intestinal areas of IBD patients showed stronger OGR1 IHC staining in inflamed mucosal segments compared to non-inflamed mucosa. IHC of human surgical samples revealed OGR1 expression in macrophages, granulocytes, endothelial cells, and fibroblasts. OGR1-dependent inositol phosphate (IP) production was significantly increased in CD14+ monocytes from IBD patients compared to healthy subjects. Primary human and murine fibroblasts exhibited OGR1-dependent IP formation, RhoA activation, F-actin, and stress fibre formation upon an acidic pH shift. OGR1 expression and signalling increases with IBD disease activity, suggesting an active role of OGR1 in the pathogenesis of IBD.

Keywords: OGR1 (GPR68) expression and function; fibroblasts; fibrosis; inflammatory bowel disease; pH-sensing GPCR.


Conflict of interest statement

G.R. discloses grant support from AbbVie, Ardeypharm, MSD, FALK, Flamentera, Novartis, Roche, Tillots, UCB, and Zeller. M.H. discloses grant support from AbbVie and Novartis. The funders had no role in the design of the study; in the collection, analyses, or interpretation of the data; in the writing of the manuscript; or in the decision to publish the results.

Figures

Figure 1
Figure 1
OGR1 mRNA expression is significantly increased in inflamed mucosa of IBD patients. (A) OGR1 mRNA expression levels in colonic resections from five non-IBD subjects, and paired samples (non-inflamed and inflamed) from eight CD patient and 11 UC patients. Data are presented as mean ± S.E.M. and statistical analysis was performed using one-way ANOVA. ** p < 0.01; *** p < 0.001. (B,C) Correlation of disease severity (Harvey–Bradshaw index for CD patients, Truelove and Witts severity index for UC patients) to OGR1 mRNA expression. Statistical analysis: Spearman’s rank correlation coefficient. (B) Non-inflamed mucosa: rs = 0.5364, p = 0.0218, n = 18. * p < 0.05. (C) Inflamed mucosa: rs = 0.6279, p = 0.0053, n = 18. ** p < 0.01. (D,E) In situ hybridization (ISH) identifying OGR1 mRNA (brown dots) in colonic tissue. Representative images are shown from a CD patient. N = 2 non-IBD subjects, paired (non-inflamed and inflamed) samples n = 2 CD patients, n = 2 UC patients. Scale bars: (D,E) overview images 100 µm; (D1,E1). Detail images, 25 µm. Controls: negative control, positive RNAscope control (peptidyl-prolyl cis-trans isomerase B). CD: Crohn’s disease; IBD: inflammatory bowel disease; OGR1: ovarian cancer G-protein-coupled receptor 1; UC: ulcerative colitis.
Figure 2
Figure 2
Immunohistochemical detection of OGR1. (A,B) OGR1 (GPR68) recombinant rabbit monoclonal antibody (16H23L16) for immunohistochemical (IHC) detection of OGR1 was verified in previously validated tools. Caco-2 clone stably overexpressing OGR1 (clone U1); negative control, Caco-2 vector control (VC) cells. (A1,A2) Strong positive OGR1 staining (brown colour), predominantly in the cytoplasm, is present in OGR1-clone U1. (B1,B2) No specific staining for OGR1 in VC cells. Counterstaining with haematoxylin. Scale bar: (A1,B1) 100 µm and (A2,B2) 25 µm. (C) Localisation of OGR1 in healthy human duodenal mucosa. Scale bars: C. Insert overview image 1 mm; detail images, (C1) 250 µm; (C2) 100 µm; (C3,C5) 50 µm; (C4,C6) 25 µm. (D) Localisation of OGR1 in duodenal tunica muscularis. Scale bars: (D1,D2) 1 mm; detail images, (D3,D4) 25 µm. OGR1: ovarian cancer G-protein-coupled receptor 1.
Figure 3
Figure 3
OGR1 protein expression is significantly increased in the inflamed mucosa of IBD patients. Immunohistochemical detection of OGR1 using the anti-OGR1 antibody 16H23L16. Paired samples: (A1A3,B1B3) non-inflamed; (A4A6,B4B6) inflamed. Representative images shown are from two CD patients. Scale bars: (A2,B2) and (A5,B5) detail images, 100 µm; (A3,B3) and (A6,B6) 25 µm. (C,D) Representative images shown are from two non-IBD subjects. Scale bars: (C1,D1) 100 µm; (C2,D2) detail images, 25 µm. Intestinal resections were taken from five non-IBD subjects and paired (non-inflamed and inflamed) samples from five CD patients and five UC patients. (E) Total protein was isolated from colonic tissue samples and Western blotting was performed using an OGR1 (GPR68) custom mouse monoclonal antibody (AbMart). (F) Densitometry after normalization of OGR1 to β-actin: five non-IBD subjects, four CD patients and four UC patients. Statistical analysis was performed using one-way ANOVA followed by Tukey’s post-test (** p < 0.01; *** p < 0.001). CD: Crohn’s disease; IBD: inflammatory bowel disease; OGR1: ovarian cancer G-protein-coupled receptor 1; UC: ulcerative colitis.
Figure 3
Figure 3
OGR1 protein expression is significantly increased in the inflamed mucosa of IBD patients. Immunohistochemical detection of OGR1 using the anti-OGR1 antibody 16H23L16. Paired samples: (A1A3,B1B3) non-inflamed; (A4A6,B4B6) inflamed. Representative images shown are from two CD patients. Scale bars: (A2,B2) and (A5,B5) detail images, 100 µm; (A3,B3) and (A6,B6) 25 µm. (C,D) Representative images shown are from two non-IBD subjects. Scale bars: (C1,D1) 100 µm; (C2,D2) detail images, 25 µm. Intestinal resections were taken from five non-IBD subjects and paired (non-inflamed and inflamed) samples from five CD patients and five UC patients. (E) Total protein was isolated from colonic tissue samples and Western blotting was performed using an OGR1 (GPR68) custom mouse monoclonal antibody (AbMart). (F) Densitometry after normalization of OGR1 to β-actin: five non-IBD subjects, four CD patients and four UC patients. Statistical analysis was performed using one-way ANOVA followed by Tukey’s post-test (** p < 0.01; *** p < 0.001). CD: Crohn’s disease; IBD: inflammatory bowel disease; OGR1: ovarian cancer G-protein-coupled receptor 1; UC: ulcerative colitis.
Figure 4
Figure 4
The OGR1 inhibitor blocked OGR1-associated downstream events in Caco-2 cells and human CD14+ monocytes. (A) OGR1 (GPR68) antibody 16H23L16 for immunocytochemical detection of OGR1 was verified in previously validated tools. Caco-2 clone stably overexpressing OGR1 (clone U1); negative control, Caco-2 vector control (VC) cells. Cells were examined by confocal microscopy (Leica, Germany). (BF) Functional assays confirmed pH-dependent OGR1-mediated signalling. (B) U1 and VC cells were subjected to an acidic pH shift and intracellular inositol phosphate (IP) formation was measured. Data are presented as mean ± SD and statistical analysis was performed using one-way ANOVA. *** p < 0.001. (C) Activated GTPase RhoA was measured in U1 and VC cells upon an acidic pH shift. (D,E) Efficacy of the OGR1 inhibitor (GPR68-I) and the enantiomer of the inhibitor were measured using electric cell-substrate impedance-sensing (ECIS) technology. OGR1 clone U1 and VC grown to confluent monolayers were subjected to an acidic pH shift with or without the OGR1 inhibitor (0.5, 1.0, 2.5, 5, 10, 25 µM). Changes in resistance of cell monolayers were monitored in real time. Representative graph of eight independent experiments shown for the inhibitor or the enantiomer. (F,G) Human CD14+ monocytes from healthy volunteers and active IBD patients were subjected to an acidic pH shift, with or without the OGR1 inhibitor (0.5, 1.0, 2.5, 5 µM). IP1 production was measured from healthy volunteers (n = 5) and active IBD patients (n = 2); active IBD patient (n = 1). Samples in (F,G) were read on the Tecan Infinite or Biotek Synergy instrument, respectively. Data are presented as mean ± SD and statistical analysis was performed using one-way ANOVA. * p < 0.05. IBD: inflammatory bowel disease; OGR1: ovarian cancer G-protein-coupled receptor 1; vector control: VC.
Figure 5
Figure 5
OGR1 expression and OGR1-dependent signalling in primary human and murine intestinal fibroblasts. (AD) Primary human fibroblasts. (A) Immunocytochemical (ICC) detection of OGR1 was confirmed in human fibroblasts using OGR1 (GPR68) antibody 16H23L16. Functional assays confirmed pH-dependent OGR1-mediated signalling. (B,C) Fibroblasts were subjected to an acidic pH shift and intracellular inositol phosphate (IP) formation was measured (n = 4–6 different fibroblast lines isolated from non-IBD patients). (D) Activated GTPase RhoA was measured in fibroblasts after an acidic pH shift (n = 3–5 different fibroblast lines isolated from non-IBD patients). (EH) Primary murine fibroblasts. (E,F) Fibroblasts were subjected to an acidic pH shift and IP formation was measured (n = 8, different murine fibroblast lines). pH-dependent OGR1-mediated signalling in fibroblasts leads to a significant increase in IP formation and is reversed by an OGR1 inhibitor. (G) RhoA activity significantly increases in WT fibroblasts but is absent in OGR1-deficient fibroblasts (n = 6 different WT fibroblast lines, n = 3 different Ogr1−/− fibroblast lines). (H) Proton-activated OGR1-mediated signalling in fibroblasts increases filamentous actin (F-actin) stress fibres at acidic pH. Positive control: rTGFβ1. Data are presented as mean ± SEM and statistical analysis was performed using one-way ANOVA. * p < 0.05; ** p < 0.01; *** p < 0.001. IBD: inflammatory bowel disease; OGR1: ovarian cancer G-protein-coupled receptor 1; rTGFβ1: recombinant transforming growth factor beta 1; WT: wild type.

Similar articles

Cited by

References

    1. Fallingborg J., Christensen L.A., Jacobsen B.A., Rasmussen S.N. Very low intraluminal colonic pH in patients with active ulcerative colitis. Dig. Dis. Sci. 1993;38:1989–1993. doi: 10.1007/BF01297074. - DOI - PubMed
    1. Press A.G., Hauptmann I.A., Hauptmann L., Fuchs B., Fuchs M., Ewe K., Ramadori G. Gastrointestinal pH profiles in patients with inflammatory bowel disease. Aliment. Pharmacol. Ther. 1998;12:673–678. doi: 10.1046/j.1365-2036.1998.00358.x. - DOI - PubMed
    1. Krawczyk C.M., Holowka T., Sun J., Blagih J., Amiel E., DeBerardinis R.J., Cross J.R., Jung E., Thompson C.B., Jones R.G., et al. Toll-like receptor-induced changes in glycolytic metabolism regulate dendritic cell activation. Blood. 2010;115:4742–4749. doi: 10.1182/blood-2009-10-249540. - DOI - PMC - PubMed
    1. Lardner A. The effects of extracellular pH on immune function. J. Leukoc. Biol. 2001;69:522–530. - PubMed
    1. Roiniotis J., Dinh H., Masendycz P., Turner A., Elsegood C.L., Scholz G.M., Hamilton J.A. Hypoxia prolongs monocyte/macrophage survival and enhanced glycolysis is associated with their maturation under aerobic conditions. J. Immunol. 2009;182:7974–7981. doi: 10.4049/jimmunol.0804216. - DOI - PubMed

Substances