Review
. 2022 Jan 27;23(3):1437.
doi: 10.3390/ijms23031437.

Assays of CFTR Function In Vitro, Ex Vivo and In Vivo

Affiliations
Review

Assays of CFTR Function In Vitro, Ex Vivo and In Vivo

Anabela Santo Ramalho et al. Int J Mol Sci. .

Abstract

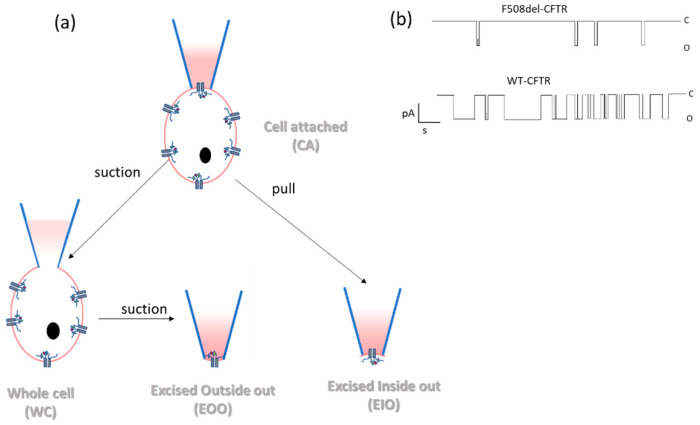
Cystic fibrosis, a multi-organ genetic disease, is characterized by abnormal function of the cystic fibrosis transmembrane conductance regulator (CFTR) protein, a chloride channel at the apical membrane of several epithelia. In recent years, therapeutic strategies have been developed to correct the CFTR defect. To evaluate CFTR function at baseline for diagnosis, or the efficacy of CFTR-restoring therapy, reliable tests are needed to measure CFTR function, in vitro, ex vivo and in vivo. In vitro techniques either directly or indirectly measure ion fluxes; direct measurement of ion fluxes and quenching of fluorescence in cell-based assays, change in transmembrane voltage or current in patch clamp or Ussing chamber, swelling of CFTR-containing organoids by secondary water influx upon CFTR activation. Several cell or tissue types can be used. Ex vivo and in vivo assays similarly evaluate current (intestinal current measurement) and membrane potential differences (nasal potential difference), on tissues from individual patients. In the sweat test, the most frequently used in vivo evaluation of CFTR function, chloride concentration or stimulated sweat rate can be directly measured. Here, we will describe the currently available bio-assays for quantitative evaluation of CFTR function, their indications, advantages and disadvantages, and correlation with clinical outcome measures.

Keywords: CFTR function; anion channel; bioassay; biomarker; cystic fibrosis.


Conflict of interest statement

The authors declare no conflict of interest related to this paper.

Figures

Figure 1
Figure 1
Diagram representation of ion transport in epithelial cells based on [19], for details, see text.
Figure 2
Figure 2
Iodide efflux assay with selective electrode. (a) Schematic representation of the iodide efflux set-up. After loading the cells with iodide and washing them, CFTR function is stimulated by forskolin (Fsk) for about 4 min. After the iodide loading and washing steps and with an interval of 1 min, the medium is refreshed and collected, starting a few minutes before CFTR stimulation with Fsk and ending some minutes after stopping CFTR stimulation. The efflux of iodide is measured in the samples using an iodide selective electrode. (b) The iodide efflux, as represented in the graph, quantitatively reflects the CFTR function in wild type compared to F508del mutant cells (illustrative tracing).
Figure 3
Figure 3
Schematic representation of the quenching assay. (a) First, cells are loaded with fluorescent probes, which induce fluorescence. Next, the cells are loaded with iodide, which induces quenching (i.e., decrease in fluorescence). After stimulation of CFTR by forskolin (Fsk), efflux of iodide through CFTR will increase the cell fluorescence again in the case of an active CFTR channel. (b) The fluorescence measured over time represents the CFTR function in wild type compared to F508del mutant cells (illustrative tracing).
Figure 4
Figure 4
Schematic representation of the Halide Sensitive-YFP quenching assay. (a) If the YFP transfected cells are grown in a medium containing chloride, fluorescence will be present. Next, CFTR is activated by forskolin and the medium is changed from chloride- to iodide-rich. This induces an influx of iodide through activated CFTR and thus quenching of the YFP fluorescence. (b) The magnitude of the drop in fluorescence over time increases with increasing CFTR function, for example, in wild type compared to F508del mutant cells (illustrative tracings).
Figure 5
Figure 5
Schematic representation of the fluorescent-based membrane potential (FMP) assay. (a) The FMP dye combining a fluorescent dye and a quencher is added on top of the cell layer. With the apical membrane at rest state (baseline condition) there is some fluorescence from the dye. Activating CFTR by agonists depolarizes the membrane by increasing the negative charges at the outside due to the efflux of chloride through CFTR. This will, in turn, increase the fluorescent signal of the dye since it moves to the positive charges (inside), releasing the quenching. When CFTR is inhibited, the membrane becomes hyperpolarized, with an excess of positive charges outside decreasing the fluorescence signal due to the fact that the dye also moves outside, leading to increased quenching of the dye. Image based on supplier information (https://www.moleculardevices.com/products/assay-kits/ion-channel/flipr-membrane-potential#Technology; accessed on 6 January 2022) (b) Illustrative tracing of the fluorescence measured over time increases with increasing CFTR function upon addition of forskolin (fsk) in wild type mutant cells and decreases with the inhibition of CFTR by inh172.
Figure 6
Figure 6
Patch clamp technique. (a) Diagram of the possible configurations (cell-attached, whole-cell, excised outside-out, and excised inside-out) for the patch-clamp assay, the inside-out configurations being the most used in CF research. (b) Simplified drawing of recordings of excised inside-out patches from heterologous cells (over)expressing wt-CFTR and F508del-CFTR (illustrative tracings of recordings based on [49]).
Figure 7
Figure 7
Isc measurements using the Ussing chamber. (a) The epithelial cells are grown on plastic porous supports (transwells), until they form a monolayer of confluent polarized cells. (b) Simplified drawing of the chambers separated by the monolayer of cells. One set of electrodes is placed near the cell monolayer to measure the voltage on both sides (potential difference-PD). This PD is then cancelled out (voltage clamped) by applying current (Isc) to the system using a second set of electrodes placed far from the cell monolayer. The Isc needed reflects the net ion transport across the cell monolayer (c) Illustrative example of a tracing for an epithelial cell monolayer expressing wildtype (wt)- or F508del-CFTR after activation by forskolin (Fsk) and 3-isobutyl-1-methylxanthine (IBMX), potentiation with ivacaftor (Iva) and inhibition by a CFTR inhibitor (inh172).
Figure 8
Figure 8
Forskolin-Induced Swelling (FIS) assay in rectal organoids from patients with CF. (a) Organoids are 3D structures of polarized cells with the apical membrane facing the lumen of the organoid. When the CFTR channel is defective, absent luminal secretion of chloride and concurrent water movement results in organoids with a slit-like or even absent lumen, even after addition of forskolin to activate CFTR. Rescue of CFTR function with modulators results in partial restoration of chloride transport and increase of the size of the lumen upon addition of forskolin. (b) Example of microscopic images of calcein stained organoids from an F508del homozygous patient at baseline (t0) and after (t60 min) activation of CFTR. In the upper panel only forskolin (Fsk) is added and no swelling is observed after 60 min. In the bottom panel, forskolin plus potentiator ivacaftor are added acutely and this after 24 h pre-incubation with correctors elexacaftor and tezacaftor. In this condition there is a considerable swelling of the organoids after 60 min, quantifying the rescue of F508del-CFTR function with this combination of compounds. (c) Illustrative tracing of organoid area increasing over time normalized to the area of the organoids at baseline (time zero).
Figure 9
Figure 9
Intestinal current measurements (ICM) done on fresh rectal biopsies (a) Diagram of ion transport mechanisms with agonist and inhibitors and (b) illustrative recordings during ICM in a perfusing Ussing chamber in a person without (left tracing), with CF and a gating mutation without (middle tracing) and with the addition of the potentiator ivacaftor. See text for details. Tracings reprinted with permission from [82]. Copyright © 2022 American Thoracic Society. All rights reserved. The American Journal of Respiratory and Critical Care Medicine is an official journal of the American Thoracic Society. Readers are encouraged to read the entire article for the correct context at [82]. The authors, editors, and The American Thoracic Society are not responsible for errors or omissions in adaptations.
Figure 10
Figure 10
Sweat test, with a schematic representation of the secretory coil (left panel) and the absorptive duct from the sweat gland (SG) of a person without CF (middle panel) and a person with CF (right panel). After stimulating sweat secretion by pilocarpine, isotonic sweat is produced in the sweat coil. In the non-CF SGs, chloride is reabsorbed through CFTR in the sweat duct, sodium follows through ENaC, but not water, resulting in hypotonic sweat with a low chloride concentration. In SGs from people with CF, CFTR is defective and sweat chloride is not/poorly reabsorbed, resulting in sweat with a high chloride concentration.
Figure 11
Figure 11
Image-based β-adrenergic sweat test. The cholinergic sweat pathway is stimulated by iontophoresis of pilocarpine; sweat secretion is captured by serial images over 10 min (p-phase). The β-adrenergic sweat pathway is then stimulated by a second iontophoresis/injection of a solution applied to the same skin site and containing atropine, aminophylline and isoproterenol plus ascorbic acid; images are then recorded over 30 min (β-phase). A Plexiglas circular well (2.27 cm2) is placed over the stimulated skin area (anode) and filled with a thin layer of unstained or erioglaucine blue-stained water-saturated mineral oil. Images are shown of sweat bubbles formed under the oil layer recorded at 10 min of the p-phase in a control (a) and in a patient with CF (b) and at 30 min of the β-phase in a control (c) and in a patient with CF (d). In panel (a), the letter “j” is one of the marks used to align successive images. Calibration bar: 1 mm. Inserts in panels (ad) magnified 3.8×. figure reprinted with permission from Journal of Cystic Fibrosis. Copyright © 2022. All rights reserved. Readers are encouraged to read the entire article for the correct context at [105]. The authors, editors, and Journal of Cystic Fibrosis are not responsible for errors or omissions in adaptations.
Figure 12
Figure 12
Nasal Potential Difference measurement. (a) Diagram of ion transport mechanisms during NPD measurements. (b) Representative tracing in a healthy control (left panel) and a person with cystic fibrosis (right panel). Reprinted with permission by the author [117]. See text for details.

Similar articles

Cited by

References

    1. Shteinberg M., Haq I.J., Polineni D., Davies J.C. Cystic fibrosis. Lancet. 2021;397:2195–2211. doi: 10.1016/S0140-6736(20)32542-3. - DOI - PubMed
    1. Lopes-Pacheco M. CFTR Modulators: The Changing Face of Cystic Fibrosis in the Era of Precision Medicine. Front. Pharmacol. 2020;10:1662. doi: 10.3389/fphar.2019.01662. - DOI - PMC - PubMed
    1. Heijerman H.G.M., McKone E.F., Downey D.G., Van Braeckel E., Rowe S.M., Tullis E., Mall M.A., Welter J.J., Ramsey B.W., McKee C.M., et al. Efficacy and safety of the elexacaftor plus tezacaftor plus ivacaftor combination regimen in people with cystic fibrosis homozygous for the F508del mutation: A double-blind, randomised, phase 3 trial. Lancet. 2019;394:1940–1948. doi: 10.1016/S0140-6736(19)32597-8. - DOI - PMC - PubMed
    1. Middleton P.G., Mall M.A., Dřevínek P., Lands L.C., McKone E.F., Polineni D., Ramsey B.W., Taylor-Cousar J.L., Tullis E., Vermeulen F., et al. Elexacaftor–Tezacaftor–Ivacaftor for Cystic Fibrosis with a Single Phe508del Allele. N. Engl. J. Med. 2019;381:1809–1819. doi: 10.1056/NEJMoa1908639. - DOI - PMC - PubMed
    1. Who Is TRIKAFTA® For?|TRIKAFTA® (Elexacaftor/Tezacaftor/Ivacaftor and Ivacaftor) n.d. [(accessed on 6 January 2022)]. Available online: https://www.trikafta.com/who-trikafta-is-for.

MeSH terms