. 2022 Jan 27;23(3):1470.
doi: 10.3390/ijms23031470.

Fine Mapping and Candidate Gene Prediction of Tuber Shape Controlling Ro Locus Based on Integrating Genetic and Transcriptomic Analyses in Potato

Affiliations

Fine Mapping and Candidate Gene Prediction of Tuber Shape Controlling Ro Locus Based on Integrating Genetic and Transcriptomic Analyses in Potato

Guiyan Fan et al. Int J Mol Sci. .

Abstract

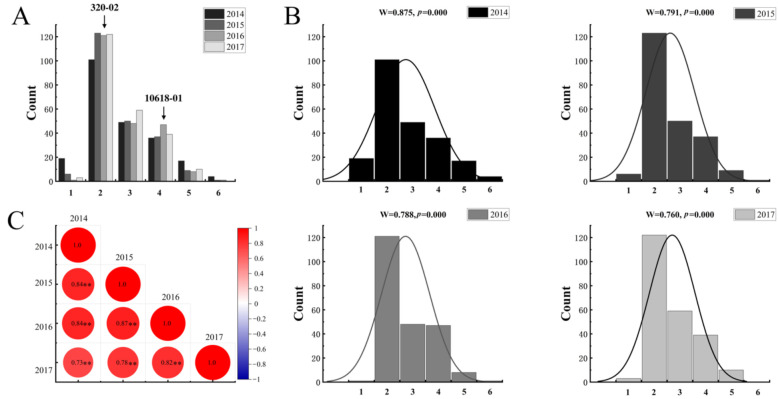
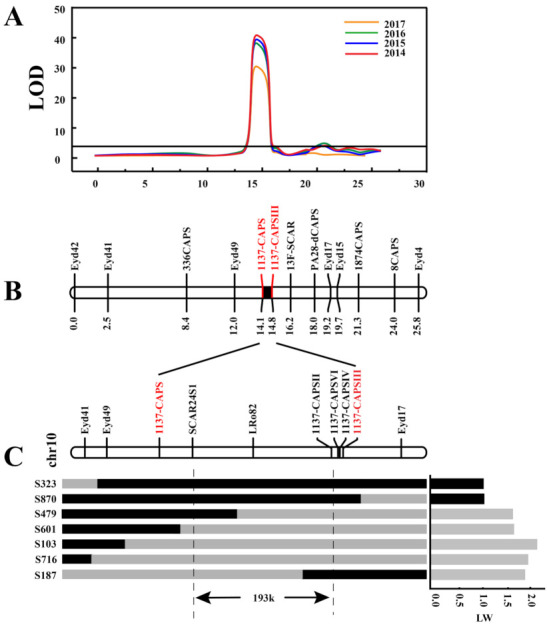
Tuber shape is one of the most important quality traits in potato appearance. Since poor or irregular shape results in higher costs for processing and influences the consumers' willingness to purchase, breeding for shape uniformity and shallow eye depth is highly important. Previous studies showed that the major round tuber shape controlling locus, the Ro locus, is located on chromosome 10. However, fine mapping and cloning of tuber shape genes have not been reported. In this study, the analyses of tissue sectioning and transcriptome sequencing showed that the developmental differences between round and elongated tuber shapes begin as early as the hook stage of the stolon. To fine map tuber shape genes, a high-density genetic linkage map of the Ro region on chromosome 10 based on a diploid segregating population was constructed. The total length of the genetic linkage map was 25.8 cM and the average marker interval was 1.98 cM. Combined with phenotypic data collected from 2014 to 2017, one major quantitative trait locus (QTL) for tuber shape was identified, which explained 61.7-72.9% of the tuber shape variation. Through the results of genotyping and phenotypic investigation of recombinant individuals, Ro was fine mapped in a 193.43 kb interval, which contained 18 genes. Five candidate genes were preliminarily predicted based on tissue sections and transcriptome sequencing. This study provides an important basis for cloning Ro gene(s).

Keywords: QTL; Solanum tuberosum L.; candidate gene prediction; tuber shape.


Conflict of interest statement

The authors declare no conflict of interest.

Figures

Figure 1
Figure 1
Tuber shape phenotype statistics. (A) Frequency distribution histogram of tuber shape (2014–2017). Different colors represent different years. The Y-axis indicates the tuber shape distribution, and the X-axis indicates the types of tuber shape: 1 = compressed, 2 = round, 3 = round-oval, 4 = oval, 5 = long-oval, and 6 = long. (B) Results of Shapiro–Wilk tests for the shape phenotype in different years. (C) Correlation analysis of tuber shape traits from 2014 to 2017; ** at the 0.01 level the correlation was significant.
Figure 2
Figure 2
Observation of tuber phenotype and histocytology at different developmental stages. (A) Tuber phenotype at different developmental stages. The figure above shows the four development periods of round potato tubers, and the figure below shows the four development periods of long potato tubers. Scale bars = 1 cm (B) LW values of differently shaped tubers from different stages. (C) Numbers of cell layers in different tuber tissues in the stolon hook stage. The number of cell layers was counted at the widest position perpendicular to the elongation direction of the stolon. Error bars represent the mean ± SD, at * p < 0.05. (D,E) Microstructure of the round tuber at the stolon hook stage in a longitudinal section, (E) enlargement of the box in (D). (F,G) Microstructure of the round tuber at the subapical expansion stage in a longitudinal section, (G) enlargement of the box in (F). (H,I) Microstructure of the elongated tuber at the stolon hook stage in a longitudinal section, (I) enlargement of the box in (H). (J,K) Microstructure of the elongated tuber at the subapical expansion stage, (K) enlargement of the box in (J). Scale bars = 100 μm.
Figure 3
Figure 3
RNA-seq analysis. (A) Heat map of expression quantity correlation of each sample. (B) Venn plot for DEGs per comparison. Non-overlapping numbers represent the number of genes unique to each pair. Overlapping numbers represent the number of mutual genes between groups. (C) Ma plot at different development stages of tubers, each point represents a gene, the abscissa indicates the log2(FPKM); the ordinate indicates log2(fold change). The red dots indicate up-regulated expression of the genes, the green dots indicate down-regulated expression of the genes, and the black dots indicate no statistically significant difference in expression of the genes. (D) Correlation analysis of data from RNA-Seq and qRT-PCR.
Figure 4
Figure 4
The top 20 enriched KEGG pathways of DEGs. (A) KEGG enrichment analysis of DEGs between L1 and R1, (B) KEGG enrichment analysis of DEGs between L2 and R2. The x-axis represents the rich factor and the y-axis represents the pathway name. The size of a circle represents the DEG number.
Figure 5
Figure 5
Fine mapping of Ro. (A) Analysis of QTLs for Ro on chromosome 10 for 2014–2017. (B) Genetic linkage map of Ro locus. (C) Fine mapping of Ro by recombinant screening. Black bars indicate the heterozygous genotype of 320-02, and gray bars indicate the homozygous recessive genotype.
Figure 6
Figure 6
The expression fold change of candidate and flanking genes. The left side represents the change of gene expression in the hook stage, the right side represents the change of gene expression in the subapical region expansion stage. The red font indicates the DEGs in the candidate interval, and the blue font indicates the DEGs in the flanking interval. Each square represents a single gene, and each gene occupies equivalent positions in each set.

Similar articles

Cited by

References

    1. Hirsch C.N., Hirsch C.D., Felcher K., Coombs J., Zarka D., Deynze A.V., Jong W.D., Veilleux R.E., Jansky S., Bethke P. Retrospective View of North American Potato (Solanum tuberosum L.) Breeding in the 20th and 21st Centuries. G3 Genes Genomes Genet. 2013;3:1003–1013. doi: 10.1534/g3.113.005595. - DOI - PMC - PubMed
    1. Si Y., Sankaran S., Knowles N.R., Pavek M.J. Potato Tuber Length-Width Ratio Assessment Using Image Analysis. Am. J. Potato Res. 2016;94:88–93. doi: 10.1007/s12230-016-9545-1. - DOI
    1. Van Eck H.J., Jacobs J., Stam P., Ton J., Stiekema W.J., Jacobsen E. Multiple alleles for tuber shape in diploid potato detected by qualitative and quantitative genetic analysis using RFLPs. Genetics. 1994;137:303–309. doi: 10.1093/genetics/137.1.303. - DOI - PMC - PubMed
    1. Zhou Q., Tang D., Huang W., Yang Z., Huang S. Haplotype-resolved genome analyses of a heterozygous diploid potato. Nat. Genet. 2020;52:1018–1023. doi: 10.1038/s41588-020-0699-x. - DOI - PMC - PubMed
    1. Jong H.D., Burns V.J. Inheritance of tuber shape in cultivated diploid potatoes. Am. Potato J. 1993;70:267–284. doi: 10.1007/BF02849314. - DOI