. 2022 Jan 28;23(3):1539.
doi: 10.3390/ijms23031539.

Analysis of mRNA and Protein Levels of CAP2, DLG1 and ADAM10 Genes in Post-Mortem Brain of Schizophrenia, Parkinson's and Alzheimer's Disease Patients

Affiliations

Analysis of mRNA and Protein Levels of CAP2, DLG1 and ADAM10 Genes in Post-Mortem Brain of Schizophrenia, Parkinson's and Alzheimer's Disease Patients

Anna Di Maio et al. Int J Mol Sci. .

Abstract

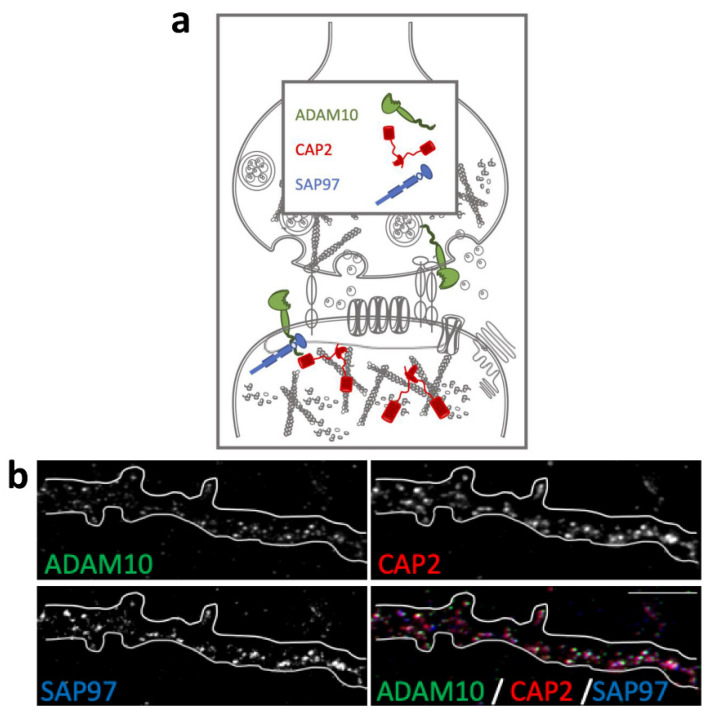
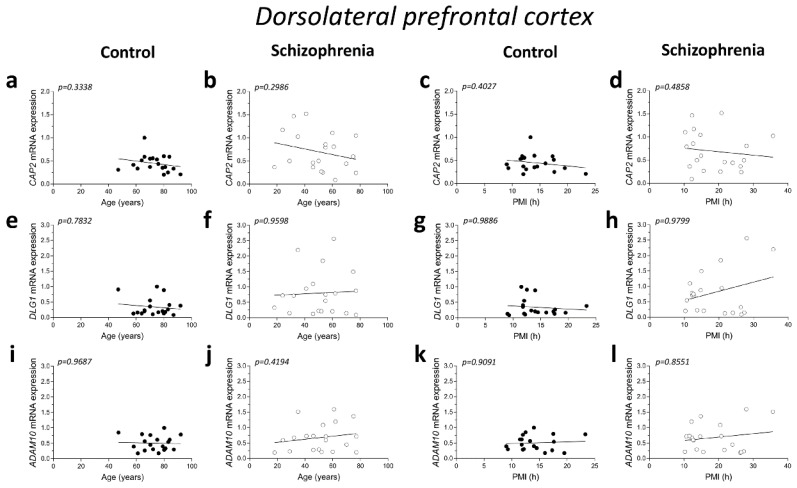
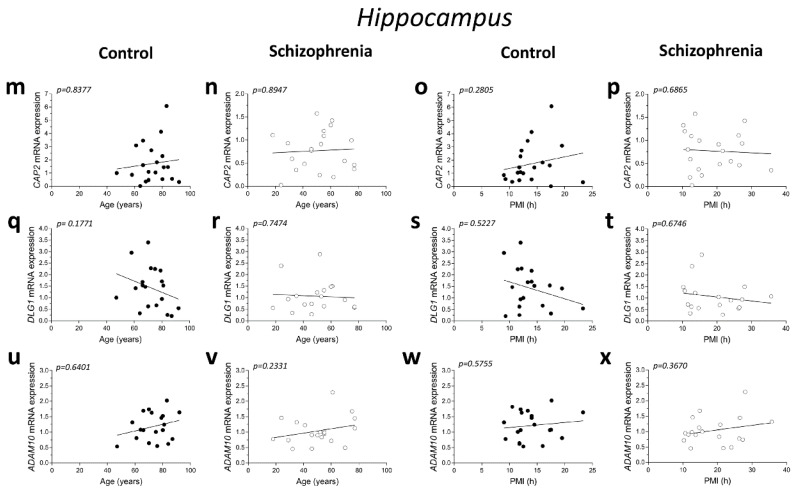
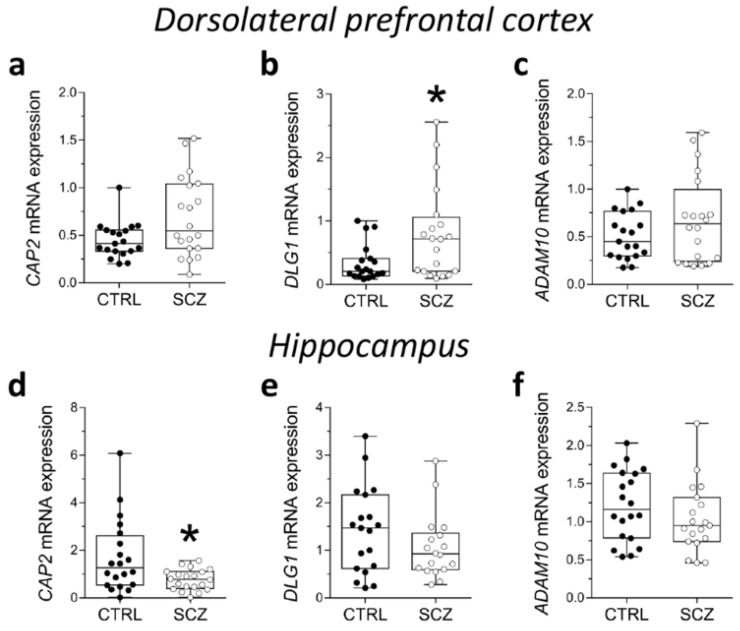
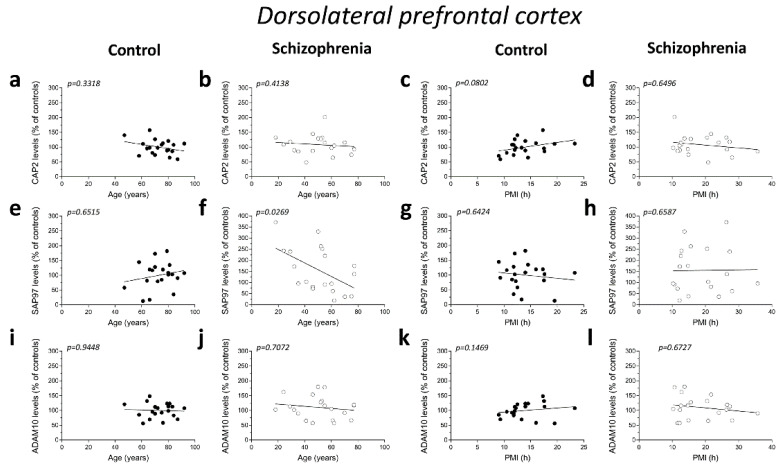
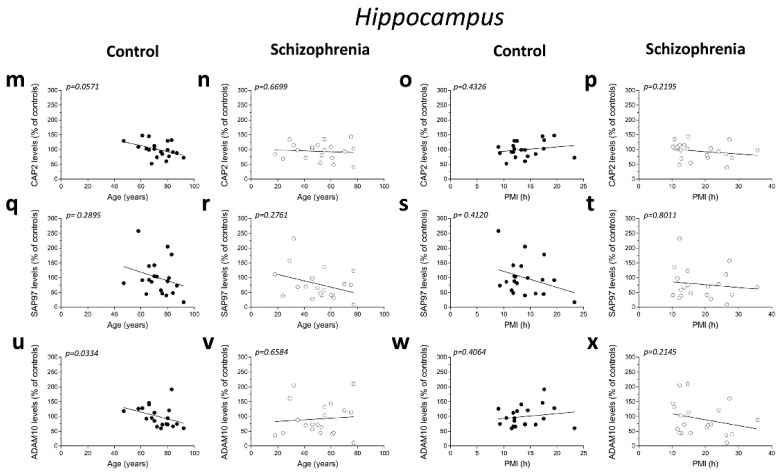
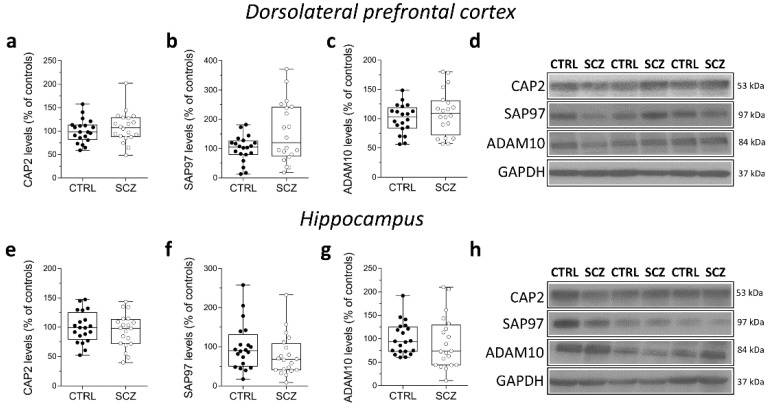
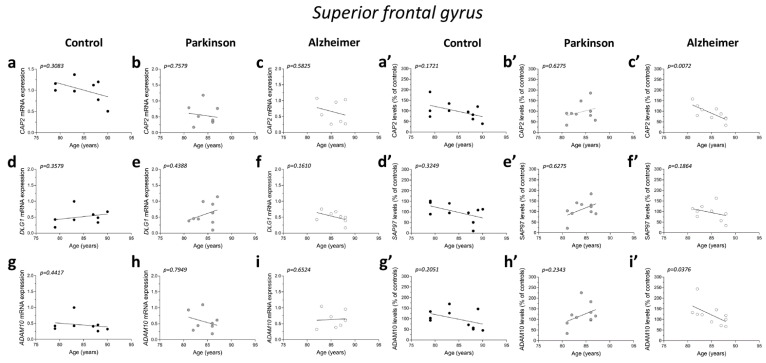
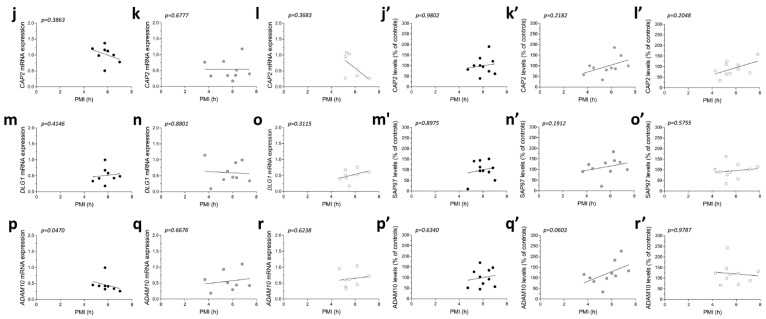
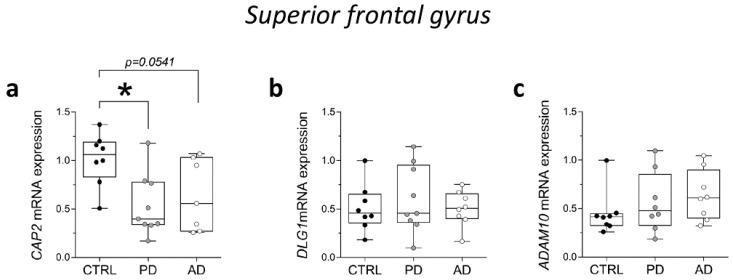
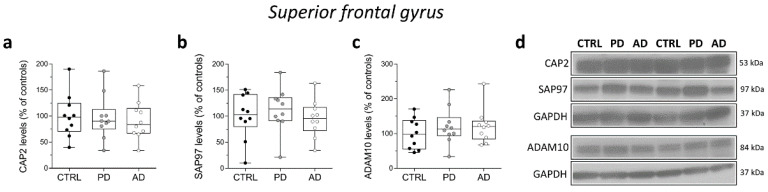
Schizophrenia (SCZ) is a mental illness characterized by aberrant synaptic plasticity and connectivity. A large bulk of evidence suggests genetic and functional links between postsynaptic abnormalities and SCZ. Here, we performed quantitative PCR and Western blotting analysis in the dorsolateral prefrontal cortex (DLPFC) and hippocampus of SCZ patients to investigate the mRNA and protein expression of three key spine shapers: the actin-binding protein cyclase-associated protein 2 (CAP2), the sheddase a disintegrin and metalloproteinase 10 (ADAM10), and the synapse-associated protein 97 (SAP97). Our analysis of the SCZ post-mortem brain indicated increased DLG1 mRNA in DLPFC and decreased CAP2 mRNA in the hippocampus of SCZ patients, compared to non-psychiatric control subjects, while the ADAM10 transcript was unaffected. Conversely, no differences in CAP2, SAP97, and ADAM10 protein levels were detected between SCZ and control individuals in both brain regions. To assess whether DLG1 and CAP2 transcript alterations were selective for SCZ, we also measured their expression in the superior frontal gyrus of patients affected by neurodegenerative disorders, like Parkinson's and Alzheimer's disease. Interestingly, also in Parkinson's disease patients, we found a selective reduction of CAP2 mRNA levels relative to controls but unaltered protein levels. Taken together, we reported for the first time altered CAP2 expression in the brain of patients with psychiatric and neurological disorders, thus suggesting that aberrant expression of this gene may contribute to synaptic dysfunction in these neuropathologies.

Keywords: Alzheimer’s disease; Parkinson’s disease; dendritic spine; postsynaptic density; schizophrenia.


Conflict of interest statement

The authors declare no conflict of interest.

Figures

Figure 1
Figure 1
Colocalization of CAP2, SAP97, and ADAM10 in primary hippocampal neurons. (a) Schematic representation of CAP2, SAP97, and ADAM10 in the glutamatergic synapse. (b) Fluorescence immunocytochemistry of ADAM10 (green), CAP2 (red), and SAP97 (blue) in primary hippocampal neurons. In the last panel (merge), a colocalization image is shown. Scale bar: 5 μm.
Figure 2
Figure 2
Correlation analysis of CAP2, DLG1, and ADAM10 mRNA expression with age and PMI in the post-mortem dorsolateral prefrontal cortex and hippocampus of schizophrenia patients. Analysis of correlation between age and mRNA expression of CAP2, DLG1, and ADAM10 in the dorsolateral prefrontal cortex of (a,e,i) control subjects (CTRL, n = 19) and (b,f,j) schizophrenia patients (SCZ, n = 20). Correlation analysis between PMI and mRNA expression of CAP2, DLG1, and ADAM10 in the dorsolateral prefrontal cortex of (c,g,k) control subjects (n = 19) and (d,h,l) schizophrenia patients (n = 20). Analysis of correlation between age and mRNA expression of CAP2, DLG1, and ADAM10 in the hippocampus of (m,q,u) control subjects (CAP2/ADAM10: n = 20; DLG1: n = 19) and (n,r,v) schizophrenia patients (CAP2: n = 20; DLG1: n = 18; ADAM10: n = 19). Correlation analysis between PMI and mRNA expression of CAP2, DLG1, and ADAM10 in the hippocampus of (o,s,w) control subjects (CAP2/ADAM10: n = 20; DLG1: n = 19) and (p,t,x) schizophrenia patients (CAP2: n = 20; DLG1: n = 18; ADAM10: n = 19).
Figure 2
Figure 2
Correlation analysis of CAP2, DLG1, and ADAM10 mRNA expression with age and PMI in the post-mortem dorsolateral prefrontal cortex and hippocampus of schizophrenia patients. Analysis of correlation between age and mRNA expression of CAP2, DLG1, and ADAM10 in the dorsolateral prefrontal cortex of (a,e,i) control subjects (CTRL, n = 19) and (b,f,j) schizophrenia patients (SCZ, n = 20). Correlation analysis between PMI and mRNA expression of CAP2, DLG1, and ADAM10 in the dorsolateral prefrontal cortex of (c,g,k) control subjects (n = 19) and (d,h,l) schizophrenia patients (n = 20). Analysis of correlation between age and mRNA expression of CAP2, DLG1, and ADAM10 in the hippocampus of (m,q,u) control subjects (CAP2/ADAM10: n = 20; DLG1: n = 19) and (n,r,v) schizophrenia patients (CAP2: n = 20; DLG1: n = 18; ADAM10: n = 19). Correlation analysis between PMI and mRNA expression of CAP2, DLG1, and ADAM10 in the hippocampus of (o,s,w) control subjects (CAP2/ADAM10: n = 20; DLG1: n = 19) and (p,t,x) schizophrenia patients (CAP2: n = 20; DLG1: n = 18; ADAM10: n = 19).
Figure 3
Figure 3
Analysis of mRNA expression of CAP2, DLG1, and ADAM10 in the post-mortem dorsolateral prefrontal cortex and hippocampus of SCZ patients. Expression levels of (a) CAP2, (b) DLG1 and (c) ADAM10 mRNA in the post-mortem dorsolateral prefrontal cortex (DLPFC) of schizophrenia-affected patients (SCZ) (n = 20) and control subjects (CTRL) (n = 19). Expression levels of (d) CAP2, (e) DLG1, and (f) ADAM10 mRNA in the post-mortem hippocampus of schizophrenic patients and controls (CAP2: CTRL/SCZ, n = 20; DLG1: CTRL, n = 19 SCZ, n = 18; ADAM10: CTRL, n = 20, SCZ, n = 19). CAP2, DLG1, and ADAM10 transcript levels were detected by quantitative RT-PCR, normalized to the mean of two housekeeping genes (ACTB and PPIA), and expressed as 2−ΔΔCt. Each dot represents values from a single subject. * p < 0.05 compared to the control group (Mann–Whitney test).
Figure 4
Figure 4
Correlation analysis of CAP2, SAP97, and ADAM10 protein levels with age and PMI in the post-mortem dorsolateral prefrontal cortex and hippocampus of schizophrenia patients. Analysis of correlation between age and protein levels of CAP2, SAP97, and ADAM10 in the dorsolateral prefrontal cortex of (a,e,i) control subjects (CTRL, n = 20) and (b,f,j) schizophrenia patients (SCZ, n = 20). Correlation analysis between PMI and protein levels of CAP2, SAP97, and ADAM10 in the dorsolateral prefrontal cortex of (c,g,k) control subjects (n = 20) and (d,h,l) schizophrenia patients (n = 20). Analysis of correlation between age and protein levels of CAP2, SAP97, and ADAM10 in the hippocampus of (m,q,u) control subjects (n = 20) and (n,r,v) schizophrenia patients (n = 20). Correlation analysis between PMI and protein levels of CAP2, SAP97, and ADAM10 in the hippocampus of (o,s,w) control subjects (n = 20) and (p,t,x) schizophrenia patients (n = 20).
Figure 4
Figure 4
Correlation analysis of CAP2, SAP97, and ADAM10 protein levels with age and PMI in the post-mortem dorsolateral prefrontal cortex and hippocampus of schizophrenia patients. Analysis of correlation between age and protein levels of CAP2, SAP97, and ADAM10 in the dorsolateral prefrontal cortex of (a,e,i) control subjects (CTRL, n = 20) and (b,f,j) schizophrenia patients (SCZ, n = 20). Correlation analysis between PMI and protein levels of CAP2, SAP97, and ADAM10 in the dorsolateral prefrontal cortex of (c,g,k) control subjects (n = 20) and (d,h,l) schizophrenia patients (n = 20). Analysis of correlation between age and protein levels of CAP2, SAP97, and ADAM10 in the hippocampus of (m,q,u) control subjects (n = 20) and (n,r,v) schizophrenia patients (n = 20). Correlation analysis between PMI and protein levels of CAP2, SAP97, and ADAM10 in the hippocampus of (o,s,w) control subjects (n = 20) and (p,t,x) schizophrenia patients (n = 20).
Figure 5
Figure 5
Analysis of protein expression of CAP2, SAP97, and ADAM10 in the post-mortem dorsolateral prefrontal cortex and hippocampus of schizophrenia patients. Quantification of CAP2, SAP97, and ADAM10 protein levels in the total homogenates of post-mortem (ac) dorsolateral prefrontal cortex (DLPFC) and (eg) hippocampus of schizophrenic subjects (SCZ, n = 20) and control group (CTRL, n = 20). The variations of CAP2, SAP97, and ADAM10 levels in schizophrenic patients are expressed as a percentage (%) of the control subjects. All markers were normalized to GAPDH for variations in loading and transfer. (d,h) Representative images of immunoblots of CAP2, SAP97, ADAM10 performed in the DLPFC and hippocampus of the control group and schizophrenia patients. Each dot represents values from a single subject. All experiments were analyzed by the Mann–Whitney test.
Figure 6
Figure 6
Correlation analysis of CAP2, SAP97, and ADAM10 mRNA and protein expression with age and PMI in the post-mortem superior frontal gyrus of Alzheimer’s and Parkinson’s disease patients. Analysis of correlation between age and mRNA expression of CAP2, DLG1, and ADAM10 in the superior frontal gyrus of (a,d,g) control subjects (CTRL, n = 8), (b,e,h) Parkinson’s disease patients (PD, CAP2/DLG1 n = 9, ADAM10: n = 8), and (c,f,i) Alzheimer’s (AD, CAP2: n = 7, DLG1/ADAM10: n = 8). Analysis of correlation between age and protein levels of CAP2, SAP97, and ADAM10 in the superior frontal gyrus of (a′,d′,g′) control subjects (CTRL, n = 10), (b′,e′,h′) Parkinson’s disease patients (PD, n = 10), and (c′,f′,i′) Alzheimer’s disease patients (AD, n = 10). Analysis of correlation between PMI and mRNA expression of CAP2, DLG1, and ADAM10 in the superior frontal gyrus of (j,m,p) control subjects (CTRL, n = 8), (k,n,q) Parkinson’s disease patients (PD, CAP2/DLG1 n = 9, ADAM10: n = 8), and (l,o,r) Alzheimer’s disease patients (AD, CAP2: n = 7, DLG1/ADAM10: n = 8). Analysis of correlation between PMI and protein levels of CAP2, SAP97, and ADAM10 in the superior frontal gyrus of (j′,m′,p′) control subjects (CTRL, n = 10), (k′,n′,q′) Parkinson’s disease patients (PD, n = 10), and (l′,o′,r′) Alzheimer’s disease patients (AD, n = 10).
Figure 6
Figure 6
Correlation analysis of CAP2, SAP97, and ADAM10 mRNA and protein expression with age and PMI in the post-mortem superior frontal gyrus of Alzheimer’s and Parkinson’s disease patients. Analysis of correlation between age and mRNA expression of CAP2, DLG1, and ADAM10 in the superior frontal gyrus of (a,d,g) control subjects (CTRL, n = 8), (b,e,h) Parkinson’s disease patients (PD, CAP2/DLG1 n = 9, ADAM10: n = 8), and (c,f,i) Alzheimer’s (AD, CAP2: n = 7, DLG1/ADAM10: n = 8). Analysis of correlation between age and protein levels of CAP2, SAP97, and ADAM10 in the superior frontal gyrus of (a′,d′,g′) control subjects (CTRL, n = 10), (b′,e′,h′) Parkinson’s disease patients (PD, n = 10), and (c′,f′,i′) Alzheimer’s disease patients (AD, n = 10). Analysis of correlation between PMI and mRNA expression of CAP2, DLG1, and ADAM10 in the superior frontal gyrus of (j,m,p) control subjects (CTRL, n = 8), (k,n,q) Parkinson’s disease patients (PD, CAP2/DLG1 n = 9, ADAM10: n = 8), and (l,o,r) Alzheimer’s disease patients (AD, CAP2: n = 7, DLG1/ADAM10: n = 8). Analysis of correlation between PMI and protein levels of CAP2, SAP97, and ADAM10 in the superior frontal gyrus of (j′,m′,p′) control subjects (CTRL, n = 10), (k′,n′,q′) Parkinson’s disease patients (PD, n = 10), and (l′,o′,r′) Alzheimer’s disease patients (AD, n = 10).
Figure 7
Figure 7
Analysis of transcript of CAP2, DLG1, and ADAM10 in the post-mortem superior frontal gyrus of Alzheimer’s and Parkinson’s disease patients. mRNA expression levels of (a) CAP2 (CTRL, n = 8, PD, n = 9, AD, n = 7), (b) DLG1 (CTRL, n = 8, PD, n = 9, AD, n = 8), and (c) ADAM10 (CTRL/PD/AD, n = 8) in the post-mortem superior frontal gyrus. CAP2, DLG1, and ADAM10 transcript levels were detected by quantitative RT-PCR, normalized to the mean of two housekeeping genes (ACTB and PPIA), and expressed as 2−ΔΔCt. Each dot represents values from a single subject. * p < 0.05 compared to the control group (Mann–Whitney test).
Figure 8
Figure 8
Analysis of protein expression of CAP2, SAP97, and ADAM10 in the post-mortem superior frontal gyrus of Alzheimer’s and Parkinson’s disease patients. Quantification of western blot analysis of (a) CAP2, (b) SAP97, and (c) ADAM10 protein levels in the total homogenates of post-mortem superior frontal gyrus (SFG) of Parkinson’s (n = 10), Alzheimer’s disease patients (n = 10), and control subjects (n = 10). The variations of CAP2, SAP97, and ADAM10 levels in patients with Parkinson’s and Alzheimer’s disease are expressed as a percentage (%) of the control subjects. All markers were normalized to GAPDH for variations in loading and transfer. (d) Representative images of immunoblots of CAP2, SAP97, and ADAM10 performed in the SFG of Parkinson’s, Alzheimer’s disease patients, and control subjects. Each dot represents values from a single subject. All experiments were analyzed by the Mann–Whitney test.

Similar articles

Cited by

References

    1. Rahman T., Lauriello J. Schizophrenia: An Overview, Focus. Am. Psychiatr. Publ. 2016;14:300–307. - PMC - PubMed
    1. Wang S.H., Hsiao P.C., Yeh L.L., Liu C.M., Liu C.C., Hwang T.J., Hsieh M.H., Chien Y.L., Lin Y.T., Chandler S.D., et al. Polygenic risk for schizophrenia and neurocognitive performance in patients with schizophrenia. Genes Brain Behav. 2018;17:49–55. doi: 10.1111/gbb.12401. - DOI - PubMed
    1. Lewis D.A., Levitt P. Schizophrenia as a disorder of neurodevelopment. Annu. Rev. Neurosci. 2002;25:409–432. doi: 10.1146/annurev.neuro.25.112701.142754. - DOI - PubMed
    1. Murray R.M., Bhavsar V., Tripoli G., Howes O. 30 Years on: How the Neurodevelopmental Hypothesis of Schizophrenia Morphed into the Developmental Risk Factor Model of Psychosis. Schizophr. Bull. 2017;43:1190–1196. doi: 10.1093/schbul/sbx121. - DOI - PMC - PubMed
    1. Rujescu D. Schizophrenia genes: On the matter of their convergence. Curr. Top. Behav. Neurosci. 2012;12:429–440. doi: 10.1007/7854_2011_183. - DOI - PubMed

MeSH terms