

Multi Platforms Strategies and Metabolomics Approaches for the Investigation of Comprehensive Metabolite Profile in Dogs with Babesia canis Infection
- PMID: 35163517
- PMCID: PMC8835742
- DOI: 10.3390/ijms23031575
Multi Platforms Strategies and Metabolomics Approaches for the Investigation of Comprehensive Metabolite Profile in Dogs with Babesia canis Infection
Abstract
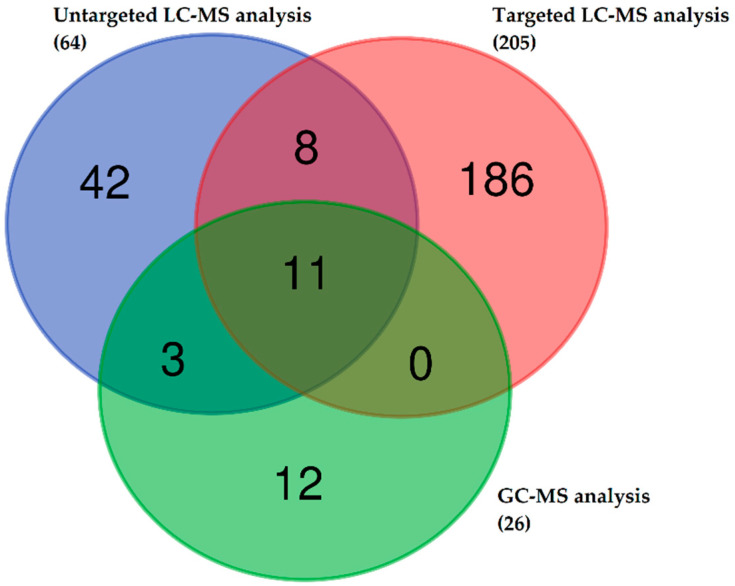
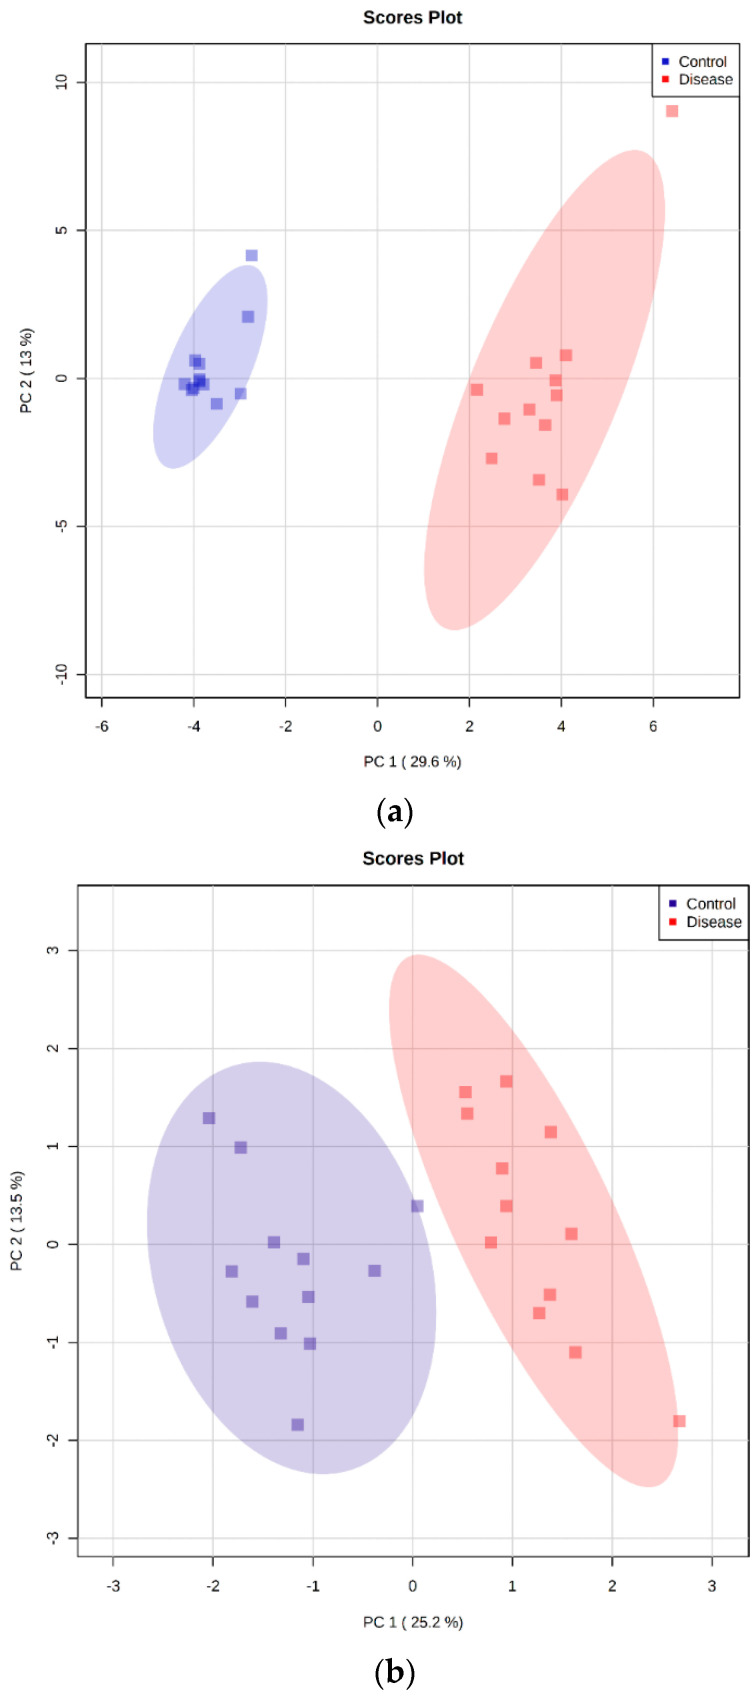
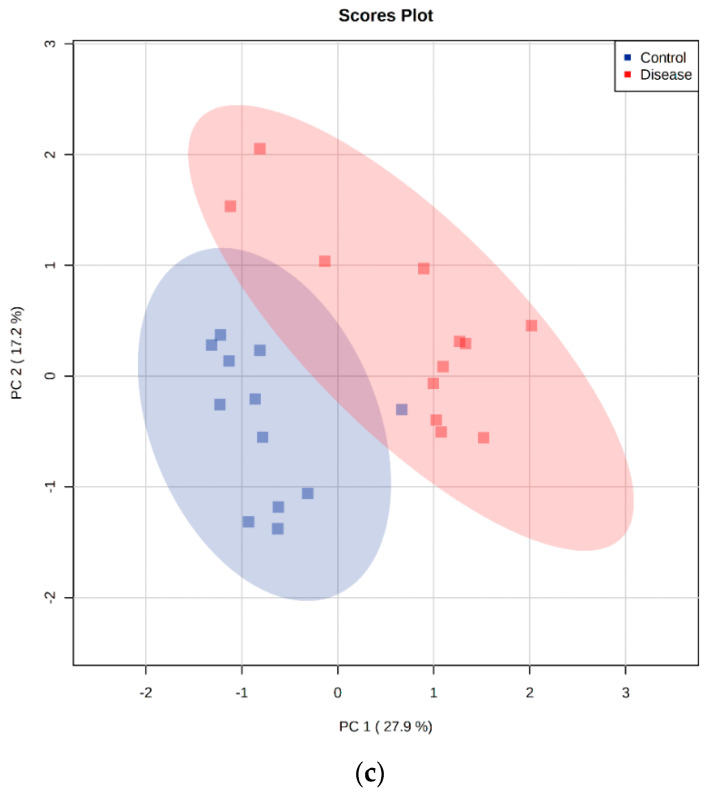
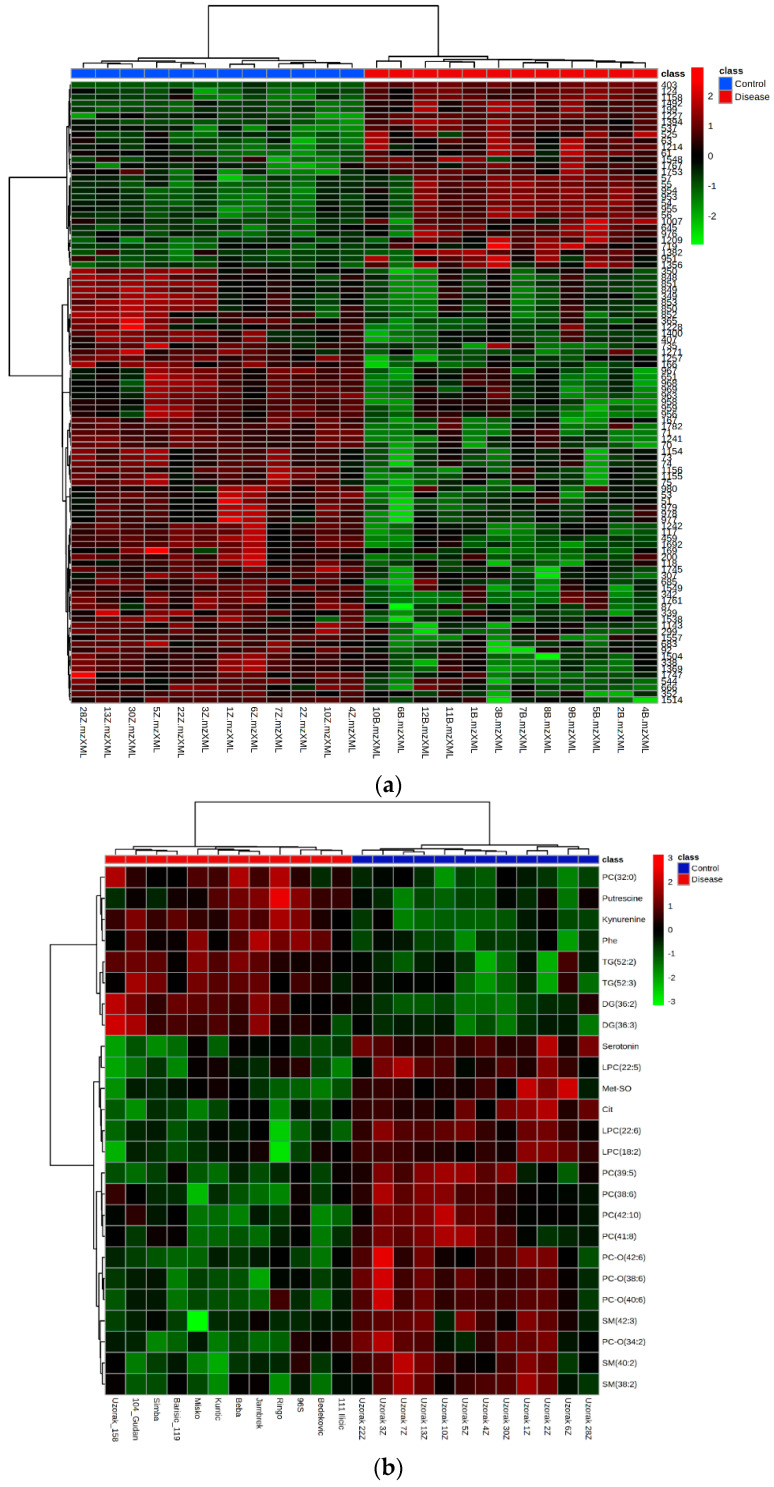
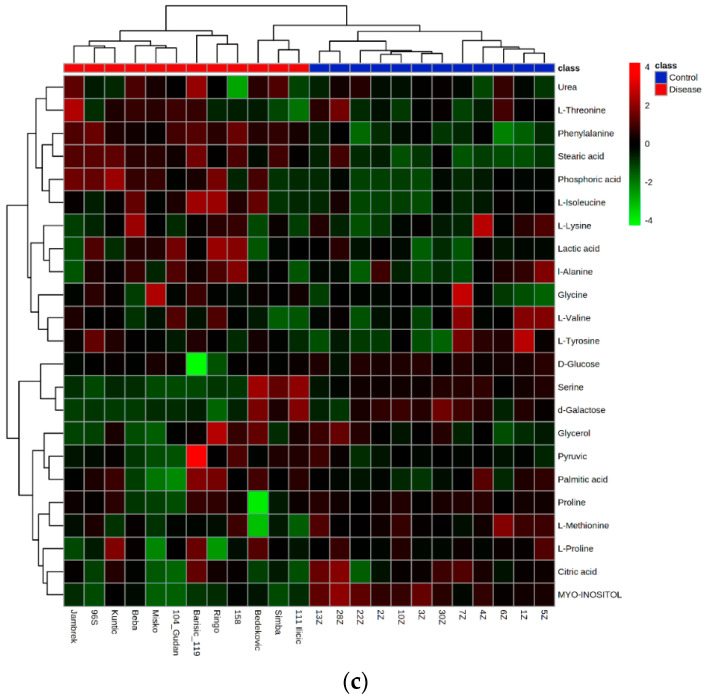
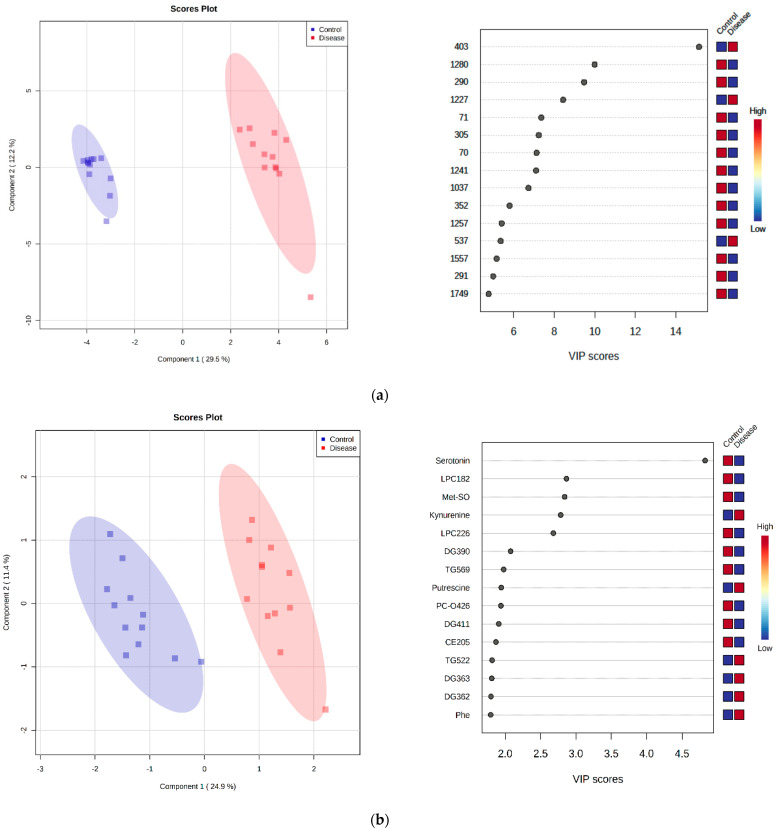
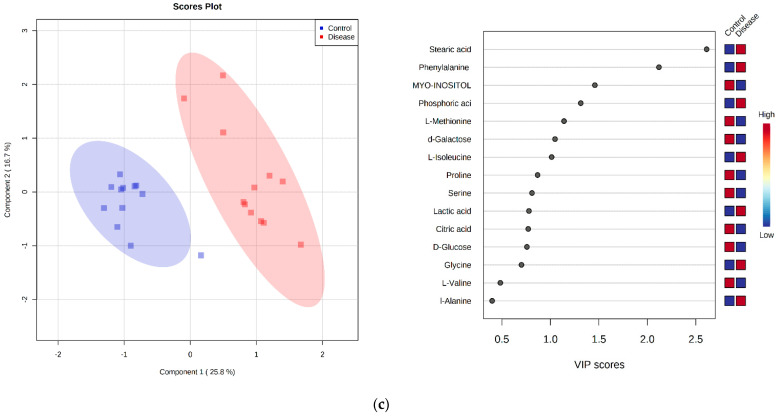
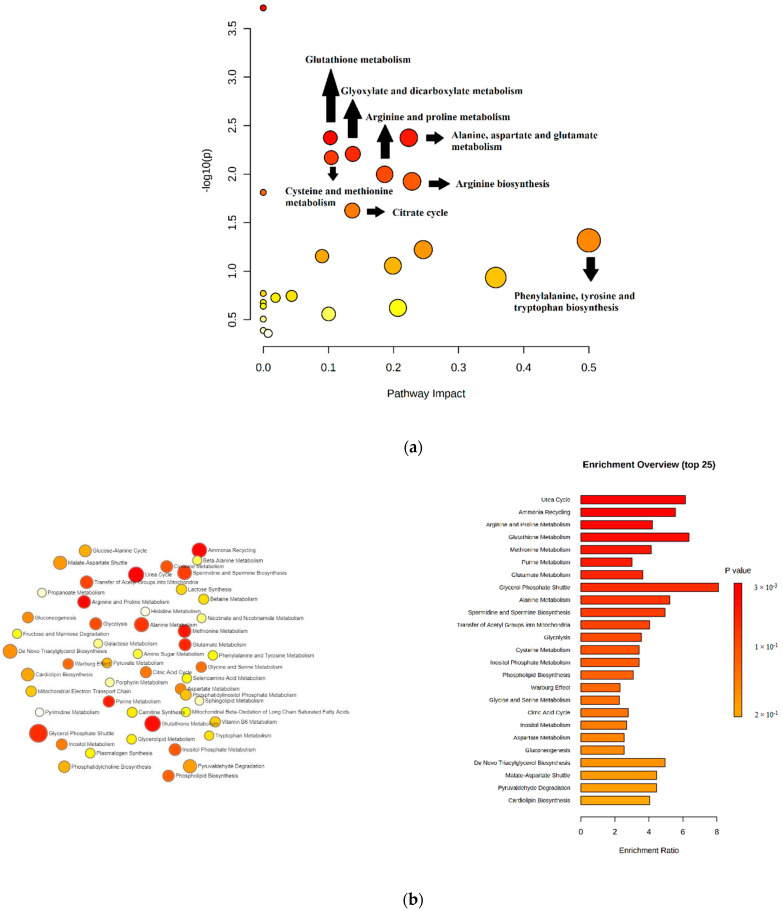
Canine babesiosis is an important tick-borne disease worldwide, caused by parasites of the Babesia genus. Although the disease process primarily affects erythrocytes, it may also have multisystemic consequences. The goal of this study was to explore and characterize the serum metabolome, by identifying potential metabolites and metabolic pathways in dogs naturally infected with Babesia canis using liquid and gas chromatography coupled to mass spectrometry. The study included 12 dogs naturally infected with B. canis and 12 healthy dogs. By combining three different analytical platforms using untargeted and targeted approaches, 295 metabolites were detected. The untargeted ultra-high performance liquid chromatography-tandem mass spectrometry (UHPLC-MS/MS) metabolomics approach identified 64 metabolites, the targeted UHPLC-MS/MS metabolomics approach identified 205 metabolites, and the GC-MS metabolomics approach identified 26 metabolites. Biological functions of differentially abundant metabolites indicate the involvement of various pathways in canine babesiosis including the following: glutathione metabolism; alanine, aspartate, and glutamate metabolism; glyoxylate and dicarboxylate metabolism; cysteine and methionine metabolism; and phenylalanine, tyrosine, and tryptophan biosynthesis. This study confirmed that host-pathogen interactions could be studied by metabolomics to assess chemical changes in the host, such that the differences in serum metabolome between dogs with B. canis infection and healthy dogs can be detected with liquid chromatography-mass spectrometry (LC-MS) and gas chromatography-mass spectrometry (GC-MS) methods. Our study provides novel insight into pathophysiological mechanisms of B. canis infection.
Keywords: Babesia canis; chromatography; mass spectrometry; metabolomics; serum.
Conflict of interest statement
The authors declare no conflict of interest.
Figures
Similar articles
-
Characterization and LC-MS/MS based proteomic analysis of extracellular vesicles separated from blood serum of healthy and dogs naturally infected by Babesia canis. A preliminary study.Vet Parasitol. 2024 Jun;328:110188. doi: 10.1016/j.vetpar.2024.110188. Epub 2024 Apr 17. Vet Parasitol. 2024. PMID: 38653059
-
Metabolomics Insights into Salivary Profile in Dogs with Babesia canis Infection.Biomolecules. 2025 Apr 1;15(4):520. doi: 10.3390/biom15040520. Biomolecules. 2025. PMID: 40305281 Free PMC article.
-
LC-MS/MS analysis of the dog serum phosphoproteome reveals novel and conserved phosphorylation sites: Phosphoprotein patterns in babesiosis caused by Babesia canis, a case study.PLoS One. 2018 Nov 28;13(11):e0207245. doi: 10.1371/journal.pone.0207245. eCollection 2018. PLoS One. 2018. PMID: 30485286 Free PMC article.
-
A review of canine babesiosis: the European perspective.Parasit Vectors. 2016 Jun 11;9(1):336. doi: 10.1186/s13071-016-1596-0. Parasit Vectors. 2016. PMID: 27289223 Free PMC article. Review.
-
Comparison of Babesia rossi and Babesia canis isolates with emphasis on effects of vaccination with soluble parasite antigens: a review.J S Afr Vet Assoc. 2009 Jun;80(2):75-8. doi: 10.4102/jsava.v80i2.174. J S Afr Vet Assoc. 2009. PMID: 19831266 Review.
Cited by
-
Omics Technologies in Veterinary Medicine: Literature Review and Perspectives in Transfusion Medicine.Transfus Med Hemother. 2023 May 25;50(3):198-207. doi: 10.1159/000530870. eCollection 2023 Jun. Transfus Med Hemother. 2023. PMID: 37408648 Free PMC article. Review.
-
Multiplatform untargeted metabolomics.Magn Reson Chem. 2023 Dec;61(12):628-653. doi: 10.1002/mrc.5350. Epub 2023 Apr 17. Magn Reson Chem. 2023. PMID: 37005774 Free PMC article. Review.
-
Chitosan-salvianolic acid B coating on the surface of nickel-titanium alloy inhibits proliferation of smooth muscle cells and promote endothelialization.Front Bioeng Biotechnol. 2023 Nov 13;11:1300336. doi: 10.3389/fbioe.2023.1300336. eCollection 2023. Front Bioeng Biotechnol. 2023. PMID: 38026871 Free PMC article.
-
Neuroprotective and vasoprotective effects of herb pair of Zhiqiao-Danggui in ischemic stroke uncovered by LC-MS/MS-based metabolomics approach.Metab Brain Dis. 2024 Aug;39(6):1131-1148. doi: 10.1007/s11011-024-01387-8. Epub 2024 Jul 13. Metab Brain Dis. 2024. PMID: 39002017
-
Serum metabolomic profiles in BALB/c mice induced by Babesia microti infection.Front Cell Infect Microbiol. 2023 Apr 28;13:1179967. doi: 10.3389/fcimb.2023.1179967. eCollection 2023. Front Cell Infect Microbiol. 2023. PMID: 37187473 Free PMC article.
References
-
- Bilić P., Kuleš J., Barić Rafaj R., Mrljak V. Canine babesiosis: Where do we stand? Acta Vet. Beogr. 2018;68:127–160. doi: 10.2478/acve-2018-0011. - DOI
-
- Jacobson L.S., A Clark I. The pathophysiology of canine babesiosis: New approaches to an old puzzle. J. S. Afr. Vet. Assoc. 1994;65:134–145. - PubMed
MeSH terms
Grants and funding
LinkOut - more resources
Full Text Sources
Miscellaneous
