. 2022 Jan 29;23(3):1589.
doi: 10.3390/ijms23031589.

The Inherent Coupling of Intrinsically Disordered Regions in the Multidomain Receptor Tyrosine Kinase KIT

Affiliations

The Inherent Coupling of Intrinsically Disordered Regions in the Multidomain Receptor Tyrosine Kinase KIT

Julie Ledoux et al. Int J Mol Sci. .

Abstract

RTK KIT regulates a variety of crucial cellular processes via its cytoplasmic domain (CD), which is composed of the tyrosine kinase domain, crowned by the highly flexible domains-the juxtamembrane region, kinase insertion domain, and C-tail, which are key recruitment regions for downstream signalling proteins. To prepare a structural basis for the characterization of the interactions of KIT with its signalling proteins (KIT INTERACTOME), we generated the 3D model of the full-length CD attached to the transmembrane helix. This generic model of KIT in inactive state was studied by molecular dynamics simulation under conditions mimicking the natural environment of KIT. With the accurate atomistic description of the multidomain KIT dynamics, we explained its intrinsic (intra-domain) and extrinsic (inter-domain) disorder and represented the conformational assemble of KIT through free energy landscapes. Strongly coupled movements within each domain and between distant domains of KIT prove the functional interdependence of these regions, described as allosteric regulation, a phenomenon widely observed in many proteins. We suggested that KIT, in its inactive state, encodes all properties of the active protein and its post-transduction events.

Keywords: allosteric regulation; conformational transition; free energy landscape; full-length KIT cytoplasmic region; intrinsically disordered regions; modelling; molecular dynamics; phosphotyrosine; receptor tyrosine kinase (RTK).


Conflict of interest statement

The authors declare no conflict of interest. The funders had no role in the design of the study; in the collection, analyses, or interpretation of data; in the writing of the manuscript, or in the decision to publish the results.

Figures

Figure 1
Figure 1
Structure of RTKs, illustrated on KIT, a member of the RTK family III. (A) Structural composition of KIT: an extracellular domain (ED) with five Ig-like regions, a transmembrane domain (TM helix), and a cytoplasmic domain (CD), composed of the juxtamembrane region (JMR), N- and C-lobe, spliced by a kinase insert domain (KID), and C-tail domain. The stem cell factor (SCF) extracellular binding induces dimerization and activation of KIT. (B) Structural model of the KIT containing CD and TM helix. The protein is shown as cartoon, membrane as grey surface, the phosphotyrosine residues (Y) as yellow balls. The KIT regions are coloured as shown on the scheme. (C) The inactive-to-active state transition of KIT is shown using the crystallographic structures of KIT CD in the inactive (PDB: 1T45) and active (PDB: 1PKG) states. In the inactive state (left), JMR (in yellow) is in the auto-inhibited conformation, stabilized through contacts with A-loop (in red), αC-helix, and C-loop. A-loop is packed to the TK domain. Both regions, JMR and A-loop, protect the catalytic site from ATP binding. In the active state (right), JMR and A-loop move from the TK domain to a solvent exposed position and deploy out of the active site, allowing ATP to access its binding site. The protein is shown as the solvent accessible surface, with JMR and A-loop as cartoon.
Figure 2
Figure 2
Folding of RTK KIT. (A) The time-related evolution of the secondary structures of the entire, full-length KIT and per domain/region, as assigned by the define secondary structure of proteins (DSSP) method [34]: α-helices in red, 310-helices in blue, parallel β strands in green, antiparallel β strands in dark blue, turns in orange, and bends in dark yellow. The three cMD replicas (1–3) were analysed individuially. (B) The 3D structure of KIT is shown by superimposition of the final conformation of the TK domain (t = 2 µs) of each trajectory. (C) The secondary structures—αH- (red), 310-helices (light blue), and β-strands (dark blue)—assigned for a mean conformation of every MD trajectory (1–3) and the crystallographic structures 1T45 and 1PKG. (D) The secondary structures—αH- (red) and β-strands (dark blue)—assigned on the mean conformation of the concateneted trajectory are labelled as in [35].
Figure 3
Figure 3
Geometry of KIT conformations from the cMD trajectory. (A) Geometry of the tetrahedrons with nodes designed on centroids (C) of the KIT domains or the C-atoms of residues, as shown on inserts. (B) Curvature between the KIT helices, TM helix, and curvature of the β-hinge of A-loop. Calculations are performed after least-square fitting of the data on the kinase domain. Conformations from different trajectories are distinguished by colour: red (1), blue (2), and yellow (3). (C) Positions of hints—TM-helix, αC-helix, αE-helix, αH1-helix, P-loop, and β-hinge of A-loop—each taken 10 ns, are superimposed on the mean conformation of KIT, calculated on the concatenated data. The protein is shown as cartoon, each hint presented by an axis of helix or vector collinear with a β-strand. Two orthogonal projections are shown. All calculations are performed on cMD conformations, each taken 10 ps from the trajectories distinguished by colour—red (1), blue (2), and yellow (3) in (B,C). The colour gradient shows the evolution of a trajectory, from light (t = 0 µs) to dark (t = 2 µs).
Figure 4
Figure 4
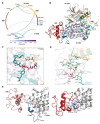
Hydrogen bonds stabilizing the inactive state of RTK KIT. (A) The cords diagram compiles the H-bonds of multidomain KIT, shown as curves, coloured according to the occurrences, from 0 (white) to 100% (violet). The H-bonds (yellow dashed lines), shown on 3D structure of KIT (B), are zoomed on the active site (C) and active site with neighbour residues (D). (E) H-bonds stabilizing C-tail at the TK domain (left) and at KID (right). (AE) The protein is shown as cartoon, in which the domains and functionally related fragments are distinguished by colour and labelled in bold and regular font, respectively. Residues contributing to H-bonds are shown as sticks and labelled in italic; the H-bonds are shown as yellow dashed lines. Calculations are performed on the concatenated trajectories 1–3.
Figure 5
Figure 5
Geometry of the tyrosine residues in KIT. The spatial distribution of the Cα-atoms from the tyrosine residues (A) and their hydroxyl groups (OH), presented by the oxygen (O) atoms (B), is shown in two orthogonal projections with the coloured Cα- and O-atoms: Y547 in orange, Y553 in magenta, Y568 in smith green, Y570 in lime, Y703 in yellow, Y721 in lilac, Y730 in red, Y747 in green, Y823 in teal, Y900 in violet, and Y936 in blue. The Cα- and O-atoms positions were extracted from the MD conformations, taken each 10 ns, fitted on the TK domain of the initial structure (t = 0 ns), and superimposed on this structure (countered cartoon in grey).
Figure 6
Figure 6
Structure and conformation of the disordered fragments of KIT—JMR, KID, A-loop, and C-tail. (A) The clusters of conformations, obtained by ensemble-based clustering (cut-off 4 Å) and their population. (B) Superimposed representative conformations from the clusters. The protein is shown as cartoon, with the tyrosine residues as sticks. The colour gradient shows the population of clusters, from dark (most populated) to light (less populated). Calculations were carried out on cMD conformations, taken every 100 ps from the concatenated trajectories after the fitting on the initial conformation of the TK domain (at t = 0 µs).
Figure 7
Figure 7
Intrinsic motion in KIT and its interdependence. (A) Dynamical inter-residue, cross-correlation map, computed for the Cα-atom pairs of MD conformations (left) and resulting from NMA (right) of KIT. The displayed results represent trajectory 1. Correlated (positive) and anti-correlated (negative) motions between Cα-atom pairs are shown as a red-blue gradient. (B) PCA modes calculated for KIT after least-square fitting of the MD conformations to the mean conformation. The bar plot gives the eigenvalue spectra, in descending order, for the first 10 modes calculated on cMD trajectories 1–3 (left). (C) Projection of the KIT cMD conformations onto the first two modes, calculated with principal component analysis (PCA) (right). MD trajectories 1, 2, and 3 denoted in red, blue, and yellow, respectively. Light and dark symbols display the first and the last conformations for each trajectory. (D) Atomic components in PCA modes 1–2 are drawn as red (1st mode) and cyan (2nd mode) arrows, projected on the cartoon of KIT. A cut-off distance of 4 Å was used.
Figure 8
Figure 8
Free energy landscape (FEL) of KIT as a function of the reaction coordinates, (A) Rg  (in Å) versus RMSD (in Å) and (B) two PCA components (PC1 versus PC2), was generated on the MD conformations of KIT for the conformational ensemble, sampled on the merged replicas and fitted on the initial conformation taken at t = 0 µs. (Left column) The two-dimensional representation of FEL of the KIT conformational ensembles. Density distribution of each reaction coordinate is shown at the top and right, respectively. (Middle column) The three-dimensional representation of the relative Gibbs free energy. (Left and middle column) The red colour represents high occurrence, yellow and green represent low, and blue represents lowest occurrence. The free energy surface was plotted using Matlab. (Right column) KIT conformations from wells 1 and 2.
Figure 9
Figure 9
Free energy landscape (FEL) of KIT and its subdomains, as a function of the reaction coordinates, Rg (in Å) versus RMSD (in Å). The FELs were generated for each entity using the ensemble of MD conformations, sampled on the merged replicas and fitted on TK domain. (Left) The two-dimensional representation of FEL. Density distribution of each reaction coordinate is shown at the top and right, respectively. (Right) The three-dimensional representation of the relative Gibbs free energy. The red colour represents high occurrences, yellow and green represent low occurrences, and blue represents the lowest occurrences. The free energy surface was plotted using Matlab.

Similar articles

Cited by

References

    1. Lemmon M.A., Schlessinger J. Cell Signaling by Receptor Tyrosine Kinases. Cell. 2010;141:1117–1134. doi: 10.1016/j.cell.2010.06.011. - DOI - PMC - PubMed
    1. Gunasekaran K., Ma B., Nussinov R. Is allostery an intrinsic property of all dynamic proteins? Proteins Struct. Funct. Bioinform. 2004;57:433–443. doi: 10.1002/prot.20232. - DOI - PubMed
    1. Changeux J., Christopoulos A. Allosteric modulation as a unifying mechanism for receptor function and regulation. Diabetes Obes. Metab. 2017;19:4–21. doi: 10.1111/dom.12959. - DOI - PubMed
    1. Locascio L.E., Donoghue D.J. KIDs rule: Regulatory phosphorylation of RTKs. Trends Biochem. Sci. 2013;38:75–84. doi: 10.1016/j.tibs.2012.12.001. - DOI - PubMed
    1. Hubbard S.R. Structural analysis of receptor tyrosine kinases. Prog. Biophys. Mol. Biol. 1999;71:343–358. doi: 10.1016/S0079-6107(98)00047-9. - DOI - PubMed

Substances

LinkOut - more resources