. 2022 Jan 30;23(3):1606.
doi: 10.3390/ijms23031606.

SARM1 Ablation Is Protective and Preserves Spatial Vision in an In Vivo Mouse Model of Retinal Ganglion Cell Degeneration

Affiliations

SARM1 Ablation Is Protective and Preserves Spatial Vision in an In Vivo Mouse Model of Retinal Ganglion Cell Degeneration

Laura K Finnegan et al. Int J Mol Sci. .

Abstract

The challenge of developing gene therapies for genetic forms of blindness is heightened by the heterogeneity of these conditions. However, mechanistic commonalities indicate key pathways that may be targeted in a gene-independent approach. Mitochondrial dysfunction and axon degeneration are common features of many neurodegenerative conditions including retinal degenerations. Here we explore the neuroprotective effect afforded by the absence of sterile alpha and Toll/interleukin-1 receptor motif-containing 1 (SARM1), a prodegenerative NADase, in a rotenone-induced mouse model of retinal ganglion cell loss and visual dysfunction. Sarm1 knockout mice retain visual function after rotenone insult, displaying preservation of photopic negative response following rotenone treatment in addition to significantly higher optokinetic response measurements than wild type mice following rotenone. Protection of spatial vision is sustained over time in both sexes and is accompanied by increased RGC survival and additionally preservation of axonal density in optic nerves of Sarm1-/- mice insulted with rotenone. Primary fibroblasts extracted from Sarm1-/- mice demonstrate an increased oxygen consumption rate relative to those from wild type mice, with significantly higher basal, maximal and spare respiratory capacity. Collectively, our data indicate that Sarm1 ablation increases mitochondrial bioenergetics and confers histological and functional protection in vivo in the mouse retina against mitochondrial dysfunction, a hallmark of many neurodegenerative conditions including a variety of ocular disorders.

Keywords: NAD+; NADase; axon degeneration; retinal degeneration; sterile alpha and Toll/interleukin-1 receptor motif-containing 1 (SARM1).


Conflict of interest statement

The authors declare no conflict of interest.

Figures
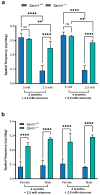
Figure 1
Figure 1
Spatial vision following rotenone insult. Rotenone was delivered bilaterally via intravitreal injection. Optokinetic responses were measured 2 months and 4 months post-injection using an OptoMotry virtual optokinetic system (Cerebral Mechanics). Bar charts represent the mean combined spatial frequency threshold. Error bars represent SD, ** p < 0.01, **** p < 0.0001. (a) Sarm1−/− mice retained a higher spatial frequency threshold following rotenone treatment compared to wild type mice. This was sustained over time (0.25 ± 0.05 cyc/deg vs. 0.09 ± 0.04 cyc/deg at 2 months post-injection; 0.29 ± 0.01 cyc/deg vs. 0.09 ± 0.03 cyc/deg at 4 months post-injection). (b) Spatial vision was preserved in both sexes over time (2 and 4 months post-injection), with no significant differences between the sexes within genotypes (2 months post-rotenone: female Sarm1+/+ 0.08 ± 0.04 cyc/deg vs. female Sarm1−/− 0.23 ± 0.02 cyc/deg, p < 0.0001; male Sarm1+/+ 0.11 ± 0.03 cyc/deg vs. male Sarm1−/− 0.26 ± 0.06, p < 0.0001. 4 months post-rotenone: female Sarm1+/+ 0.09 ± 0.03 cyc/deg vs. female Sarm1−/− 0.28 ± 0.01 cyc/deg; p < 0.0001, male Sarm1+/+ 0.08 ± 0.01 cyc/deg vs. male Sarm1−/− 0.29 ± 0.01 cyc/deg, p < 0.0001).
Figure 2
Figure 2
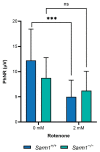
Analysis of PhNR. Rotenone was delivered via intravitreal injection. PhNRs were measured six weeks post-injection. Bar charts represent the mean PhNR. Error bars represent SD, *** p < 0.001, ns = non-significant. Reduction in PhNR following rotenone treatment was significantly greater in wild type Sarm1+/+ mice (12.23 ± 6.22 μV vs. 5.01 ± 3.3 μV; p < 0.001) than Sarm1−/− mice, where the reduction was not significant (8.75 ± 4.04 μV vs. 6.23 ± 3.85 μV).
Figure 3
Figure 3
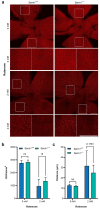
Quantification of retinal ganglion cells. Two months after intravitreal injection of rotenone, eyes were enucleated, fixed and dissected. Retinas were stained for BRN3A and wholemounted. Representative images of each retina are denoted by white squares. Scale bars = 500 µm (a). (b) Labelled RGCs were quantified using Olympus CellSens software. Number of RGCs is significantly reduced in both genotypes following rotenone treatment (Sarm1+/+ 2752 ± 215 RGCs/mm2 vs. 959 ± 537 RGCs/mm2; Sarm1−/− 2824 ± 164 RGCs/mm2 vs. 1352 ± 275 RGCs/mm2 p < 0.0001). There were significantly more RGCs in Sarm1−/− retinas following rotenone treatment (n = 11) relative to wild type (n = 10; 1352 ± 275 RGCs/mm2 vs. 959 ± 537 RGCs/mm2; p < 0.05). (c) Mean distance between RGCs in rotenone-treated retinas was calculated using the BioVoxxel toolbox on ImageJ. Each bar represents the average mean distance between neighbouring RGCs, (n = 9–11). There was a trend towards decreased distance between Sarm1−/− RGCs relative to wild type (24.99 ± 7.39 μm, range 20.51 μm vs. 31.65 ± 14.66 μm, range 41.87 μm; p = 0.1761). Error bars (b,c) represent SD values and * p < 0.05, ns = non-significant.
Figure 4
Figure 4
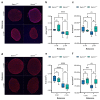
Quantification of axons. Two months after intravitreal injection of rotenone, eyes were enucleated, fixed and dissected. Optic nerves were cryosectioned (7 μm) and stained for NF200 (red). Nuclei were stained with DAPI (blue). Segments of the proximal (a) and distal (d) optic nerve, the portion of the nerve nearest the eye and brain respectively, were sectioned and analysed separately. Scale bars (a,d) = 50 µm. (b,c,e,f) Axons and optic nerve area were quantified using Olympus CellSens software. Optic nerves were thinner following rotenone insult in both genotypes (n = 6–10), both close to the eye ((b); Sarm1+/+ 0.10 ± 0.004 mm2 vs. 0.07 ± 0.02 mm2, p < 0.05; Sarm1−/− 0.11 ± 0.02 mm2 vs. 0.07 ± 0.02 mm2, p < 0.001) and brain ((e) Sarm1+/+ 0.12 ± 0.02 mm2 vs. 0.08 ± 0.01 mm2, p < 0.0001, Sarm1−/− 0.11 ± 0.02 mm2 vs. 0.07 ± 0.01 mm2, p < 0.0001). Density of axons was protected in Sarm1−/− optic nerves, with no significant difference between insulted and non-insulted sections from proximal ((c) 201,631 ± 12,619 axons/mm2 vs. 196,265 ± 3030 axons/mm2) or distal ((f) 188,764 ± 13,580 axons/mm2 vs. 194,208 ± 9417 axons/mm2) Sarm1−/− optic nerves. There was a significant reduction in axonal density in wild type optic nerves receiving rotenone relative to both non-insulted Sarm1+/+ and insulted Sarm1−/− optic nerves (n = 6–10; Proximal: rotenone-insulted Sarm1+/+ 187,926 ± 7851 axons/mm2 vs. uninjected Sarm1+/+ 200,835 ± 9874 axons/mm2 p < 0.05; rotenone-insulted Sarm1+/+ 187,926 ± 7851 axons/mm2 vs. rotenone-insulted Sarm1−/− 201,631 ± 12,619 axons/mm2, p < 0.05. Distal: rotenone-insulted Sarm1+/+ 172,002 ± 7086 axons/mm2 vs. uninjected Sarm1+/+ 190,789 ± 7402 axons/mm2, p < 0.01; rotenone-insulted Sarm1+/+ 172,002 ± 7086 axons/mm2 vs. rotenone-insulted Sarm1−/− 188,764 ± 13,580 axons/mm2, p < 0.05). Error bars (bc,ef) represent SD values, * p < 0.05, ** p < 0.01 and *** p < 0.001, **** p < 0.0001, ns = non-significant.
Figure 5
Figure 5
Growth and bioenergetics of Sarm1+/+ and Sarm1−/− primary fibroblasts. (a) Growth rate over time. Mean growth rate (proportional increase in cell population over time) for each genotype is plotted against days in culture. Sarm1+/+ (n = 5) shown in blue, Sarm1−/− (n = 5) shown in green. Growth rates were similar in both genotypes, with populations beginning to contract after 18 days in culture. (b) ROS accumulation following rotenone treatment. Sarm1+/+ (n = 4) and Sarm1−/− fibroblasts (n = 5) were treated with 2.5 µM rotenone for 4, 18 and 24 h before ROS accumulation was assayed through DCFDA assay. ROS accumulated to a similar degree in both genotypes (4 h: Sarm1+/+ 109.11 ± 4.02% fluorescence relative to control vs. Sarm1−/− 94.92 ± 19.94%; 18 h: Sarm1+/+ 159.09 ± 49.40% vs. Sarm1−/− 147.35 ± 48.79%; 24 h: Sarm1+/+ 132.62 ± 18.67% vs. Sarm1−/− 260.50 ± 185.11%). (c,d) Real time measurements of OCR were taken using the Seahorse XFe96 Analyser. Oligomycin (1.0 µM), FCCP (1.0 µM), rotenone (0.5 µM) and antimycin A (0.5 µM) were injected sequentially. Basal and maximal OCR, and ATP production were increased in Sarm1−/− fibroblasts relative to wild type (44.38 ± 2.26 pmol/min vs. 28.31 ± 6.10 pmol/min, p < 0.001; 14.28 ± 1.78 pmol/min vs. 7.80 ± 5.67 pmol/min, p < 0.05; 23.73 ± 2.57 pmol/min vs. 16.38 ± 2.62 pmol/min, p < 0.001); while SRC demonstrated a non-significant trend towards an increase in Sarm1−/− fibroblasts relative to wild type. Error bars represent SD values, ** p < 0.01, *** p < 0.001, ns = non-significant.

Similar articles

Cited by

References

    1. Carelli V., La Morgia C., Ross-Cisneros F.N., Sadun A.A. Optic neuropathies: The tip of the neurodegeneration iceberg. Hum. Mol. Genet. 2017;26:R139–R150. doi: 10.1093/hmg/ddx273. - DOI - PMC - PubMed
    1. La Morgia C., Ross-Cisneros F.N., Koronyo Y., Hannibal J., Gallassi R., Cantalupo G., Sambati L., Pan B.X., Tozer K.R., Barboni P., et al. Melanopsin retinal ganglion cell loss in Alzheimer disease. Ann. Neurol. 2016;79:90–109. doi: 10.1002/ana.24548. - DOI - PMC - PubMed
    1. Alqawlaq S., Flanagan J.G., Sivak J.M. All roads lead to glaucoma: Induced retinal injury cascades contribute to a common neurodegenerative outcome. Exp. Eye Res. 2019;183:88–97. doi: 10.1016/j.exer.2018.11.005. - DOI - PubMed
    1. Raff M.C., Whitmore A.V., Finn J.T. Axonal self-destruction and neurodegeneration. Science. 2002;296:868–871. doi: 10.1126/science.1068613. - DOI - PubMed
    1. Libby R.T., Li Y., Savinova O.V., Barter J., Smith R.S., Nickells R.W., John S.W.M. Susceptibility to neurodegeneration in a glaucoma is modified by bax gene dosage. PLoS Genet. 2005;1:17–26. doi: 10.1371/journal.pgen.0010004. - DOI - PMC - PubMed

MeSH terms

LinkOut - more resources