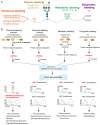
Strategies for Proteome-Wide Quantification of Glycosylation Macro- and Micro-Heterogeneity
- PMID: 35163546
- PMCID: PMC8835892
- DOI: 10.3390/ijms23031609
Strategies for Proteome-Wide Quantification of Glycosylation Macro- and Micro-Heterogeneity
Abstract
Protein glycosylation governs key physiological and pathological processes in human cells. Aberrant glycosylation is thus closely associated with disease progression. Mass spectrometry (MS)-based glycoproteomics has emerged as an indispensable tool for investigating glycosylation changes in biological samples with high sensitivity. Following rapid improvements in methodologies for reliable intact glycopeptide identification, site-specific quantification of glycopeptide macro- and micro-heterogeneity at the proteome scale has become an urgent need for exploring glycosylation regulations. Here, we summarize recent advances in N- and O-linked glycoproteomic quantification strategies and discuss their limitations. We further describe a strategy to propagate MS data for multilayered glycopeptide quantification, enabling a more comprehensive examination of global and site-specific glycosylation changes. Altogether, we show how quantitative glycoproteomics methods explore glycosylation regulation in human diseases and promote the discovery of biomarkers and therapeutic targets.
Keywords: glycoproteomics; label free; mass spectrometry; quantification; stable-isotope labeling.
Conflict of interest statement
The authors declare no conflict of interest.
Figures


References
-
- Flynn R.A., Pedram K., Malaker S.A., Batista P.J., Smith B.A.H., Johnson A.G., George B.M., Majzoub K., Villalta P.W., Carette J.E., et al. Small RNAs are modified with N-glycans and displayed on the surface of living cells. Cell. 2021;184:3109–3124.e22. doi: 10.1016/j.cell.2021.04.023. - DOI - PMC - PubMed
-
- Hu Y., Pan J., Shah P., Ao M., Thomas S.N., Liu Y., Chen L., Schnaubelt M., Clark D.J., Rodriguez H., et al. Clinical Proteomic Tumor Analysis, C. Integrated proteomic and glycoproteomic characterization of human high-grade serous ovarian carcinoma. Cell Rep. 2020;33:108276. doi: 10.1016/j.celrep.2020.108276. - DOI - PMC - PubMed
-
- Pan J., Hu Y., Sun S., Chen L., Schnaubelt M., Clark D., Ao M., Zhang Z., Chan D., Qian J., et al. Glycoproteomics-based signatures for tumor subtyping and clinical outcome prediction of high-grade serous ovarian cancer. Nat. Commun. 2020;11:6139. doi: 10.1038/s41467-020-19976-3. - DOI - PMC - PubMed
-
- Mereiter S., Polom K., Williams C., Polonia A., Guergova-Kuras M., Karlsson N.G., Roviello F., Magalhaes A., Reis C.A. The Thomsen-Friedenreich antigen: A highly sensitive and specific predictor of microsatellite instability in gastric cancer. J. Clin. Med. 2018;7:256. doi: 10.3390/jcm7090256. - DOI - PMC - PubMed
Publication types
MeSH terms
Substances
LinkOut - more resources
Full Text Sources

