

High Iron and Iron Household Protein Contents in Perineuronal Net-Ensheathed Neurons Ensure Energy Metabolism with Safe Iron Handling
- PMID: 35163558
- PMCID: PMC8836250
- DOI: 10.3390/ijms23031634
High Iron and Iron Household Protein Contents in Perineuronal Net-Ensheathed Neurons Ensure Energy Metabolism with Safe Iron Handling
Abstract
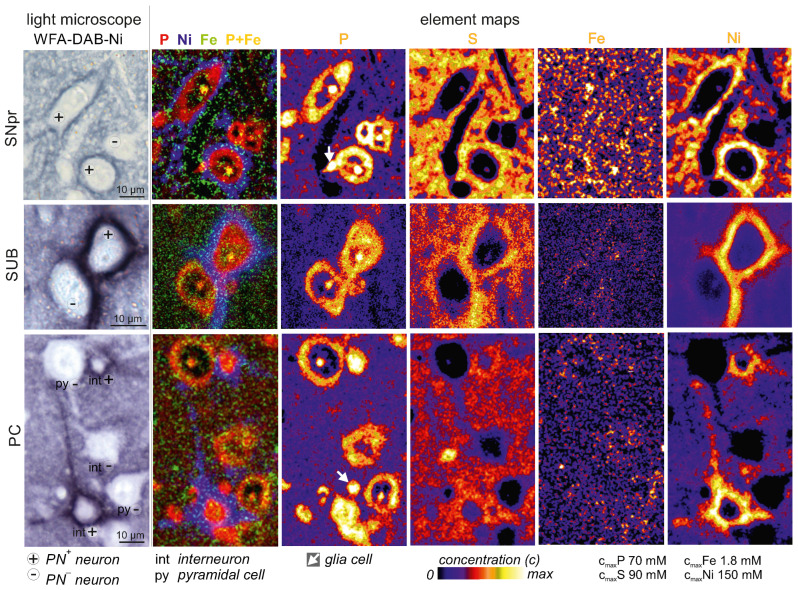
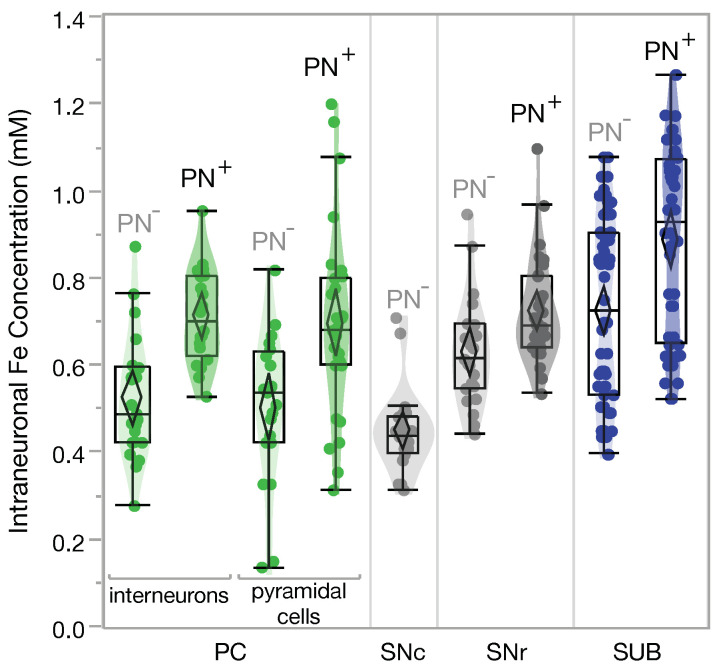
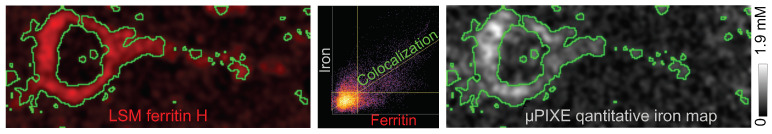
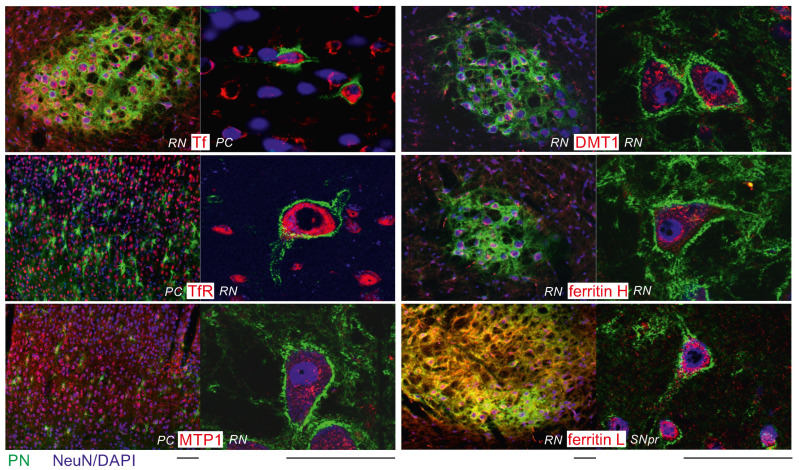
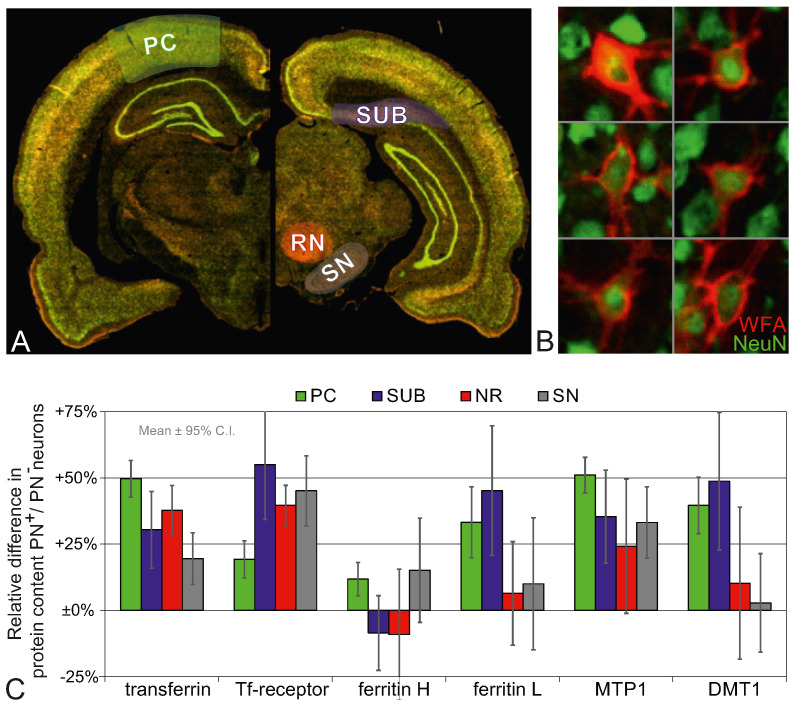
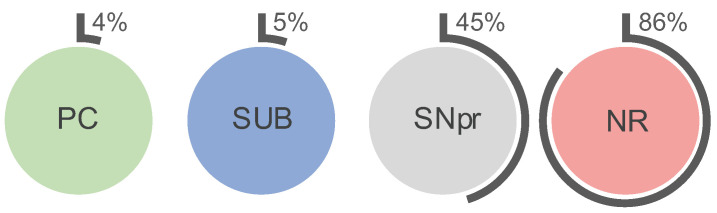
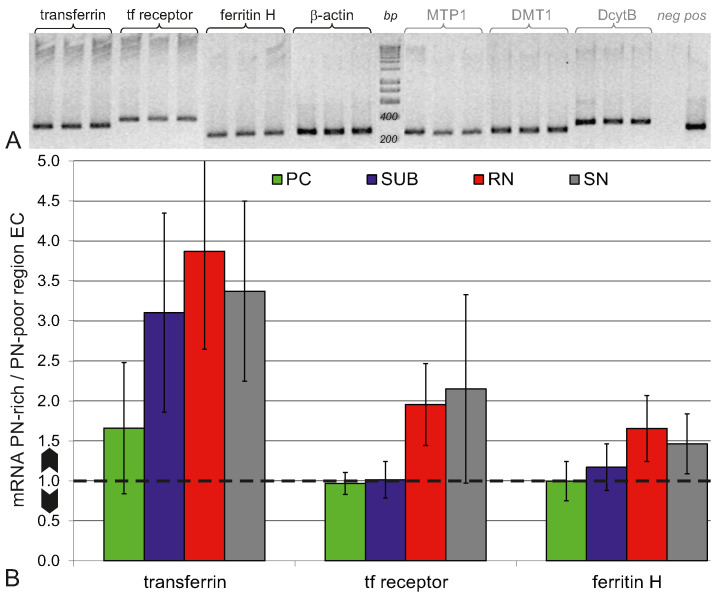
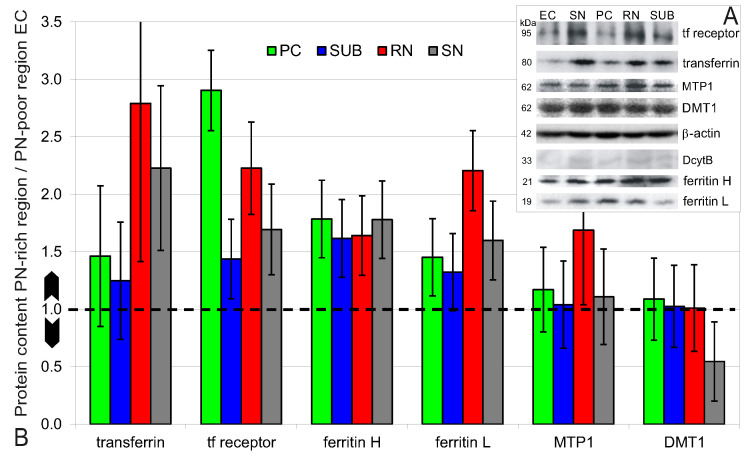
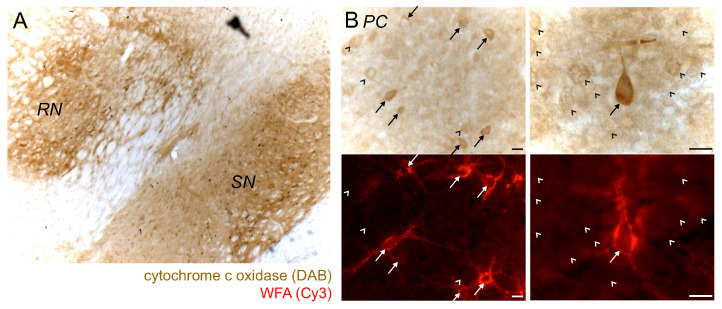
A subpopulation of neurons is less vulnerable against iron-induced oxidative stress and neurodegeneration. A key feature of these neurons is a special extracellular matrix composition that forms a perineuronal net (PN). The PN has a high affinity to iron, which suggests an adapted iron sequestration and metabolism of the ensheathed neurons. Highly active, fast-firing neurons-which are often ensheathed by a PN-have a particular high metabolic demand, and therefore may have a higher need in iron. We hypothesize that PN-ensheathed neurons have a higher intracellular iron concentration and increased levels of iron proteins. Thus, analyses of cellular and regional iron and the iron proteins transferrin (Tf), Tf receptor 1 (TfR), ferritin H/L (FtH/FtL), metal transport protein 1 (MTP1 aka ferroportin), and divalent metal transporter 1 (DMT1) were performed on Wistar rats in the parietal cortex (PC), subiculum (SUB), red nucleus (RN), and substantia nigra (SNpr/SNpc). Neurons with a PN (PN+) have higher iron concentrations than neurons without a PN: PC 0.69 mM vs. 0.51 mM, SUB 0.84 mM vs. 0.69 mM, SN 0.71 mM vs. 0.63 mM (SNpr)/0.45 mM (SNpc). Intracellular Tf, TfR and MTP1 contents of PN+ neurons were consistently increased. The iron concentration of the PN itself is not increased. We also determined the percentage of PN+ neurons: PC 4%, SUB 5%, SNpr 45%, RN 86%. We conclude that PN+ neurons constitute a subpopulation of resilient pacemaker neurons characterized by a bustling iron metabolism and outstanding iron handling capabilities. These properties could contribute to the low vulnerability of PN+ neurons against iron-induced oxidative stress and degeneration.
Keywords: DMT1; MTP1; brain; cellular quantification; ferritin H/L; iron; iron proteins; neurodegeneration; perineuronal net; transferrin; transferrin receptor.
Conflict of interest statement
The authors declare no conflict of interest.
Figures
Similar articles
-
Iron Metabolism in the Peripheral Nervous System: The Role of DMT1, Ferritin, and Transferrin Receptor in Schwann Cell Maturation and Myelination.J Neurosci. 2019 Dec 11;39(50):9940-9953. doi: 10.1523/JNEUROSCI.1409-19.2019. Epub 2019 Nov 1. J Neurosci. 2019. PMID: 31676601 Free PMC article.
-
Neurodegeneration with inflammation is accompanied by accumulation of iron and ferritin in microglia and neurons.Neurobiol Dis. 2015 Sep;81:108-18. doi: 10.1016/j.nbd.2015.03.013. Epub 2015 Mar 20. Neurobiol Dis. 2015. PMID: 25801802
-
The metabolism of neuronal iron and its pathogenic role in neurological disease: review.Ann N Y Acad Sci. 2004 Mar;1012:14-26. doi: 10.1196/annals.1306.002. Ann N Y Acad Sci. 2004. PMID: 15105252 Review.
-
Inflammation-induced iron transport and metabolism by brain microglia.J Biol Chem. 2018 May 18;293(20):7853-7863. doi: 10.1074/jbc.RA118.001949. Epub 2018 Apr 2. J Biol Chem. 2018. PMID: 29610275 Free PMC article.
-
Mechanisms and regulation of intestinal iron absorption.Blood Cells Mol Dis. 2002 Nov-Dec;29(3):384-99. doi: 10.1006/bcmd.2002.0578. Blood Cells Mol Dis. 2002. PMID: 12547229 Review.
Cited by
-
Nanoenabled Intracellular Metal Ion Homeostasis Regulation for Tumor Therapy.Adv Sci (Weinh). 2024 Feb;11(7):e2306203. doi: 10.1002/advs.202306203. Epub 2023 Dec 8. Adv Sci (Weinh). 2024. PMID: 38063781 Free PMC article. Review.
-
Editorial to the Special Issue "Homeostasis: Metals and Cellular Redox and Immunity Status".Int J Mol Sci. 2023 Mar 3;24(5):4889. doi: 10.3390/ijms24054889. Int J Mol Sci. 2023. PMID: 36902319 Free PMC article.
-
Mechanism of ferroptosis regulating ischemic stroke and pharmacologically inhibiting ferroptosis in treatment of ischemic stroke.CNS Neurosci Ther. 2024 Jul;30(7):e14865. doi: 10.1111/cns.14865. CNS Neurosci Ther. 2024. PMID: 39042604 Free PMC article. Review.
References
MeSH terms
Substances
Grants and funding
LinkOut - more resources
Full Text Sources
Medical
Research Materials
Miscellaneous
