. 2022 Jan 31;23(3):1646.
doi: 10.3390/ijms23031646.

Conformational Flexibility and Local Frustration in the Functional States of the SARS-CoV-2 Spike B.1.1.7 and B.1.351 Variants: Mutation-Induced Allosteric Modulation Mechanism of Functional Dynamics and Protein Stability

Affiliations

Conformational Flexibility and Local Frustration in the Functional States of the SARS-CoV-2 Spike B.1.1.7 and B.1.351 Variants: Mutation-Induced Allosteric Modulation Mechanism of Functional Dynamics and Protein Stability

Gennady Verkhivker. Int J Mol Sci. .

Abstract

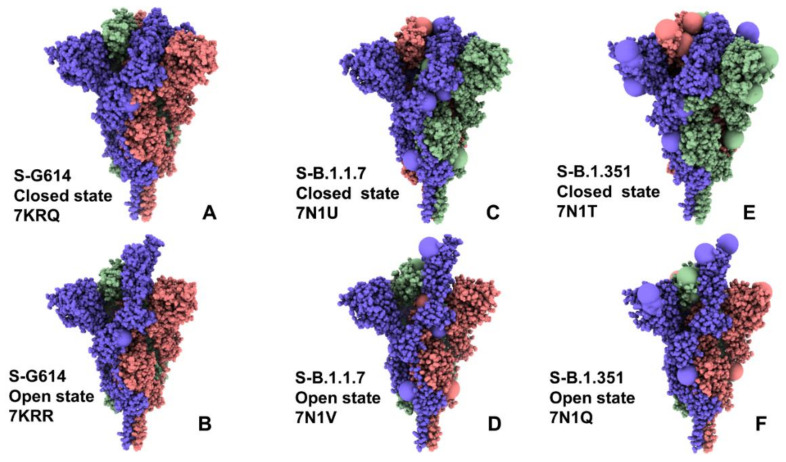
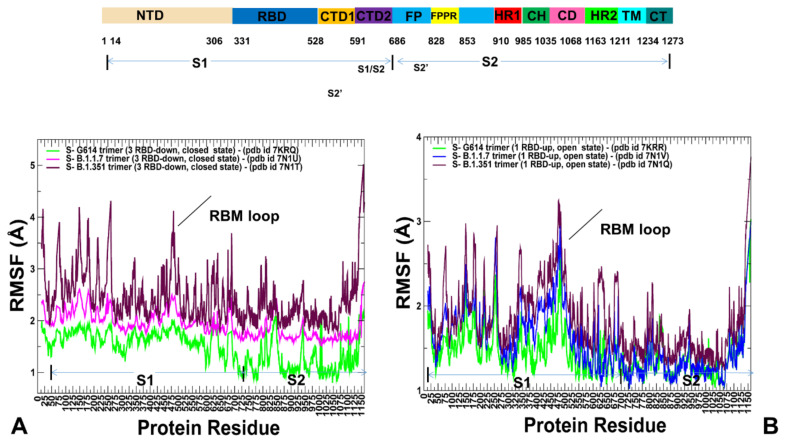
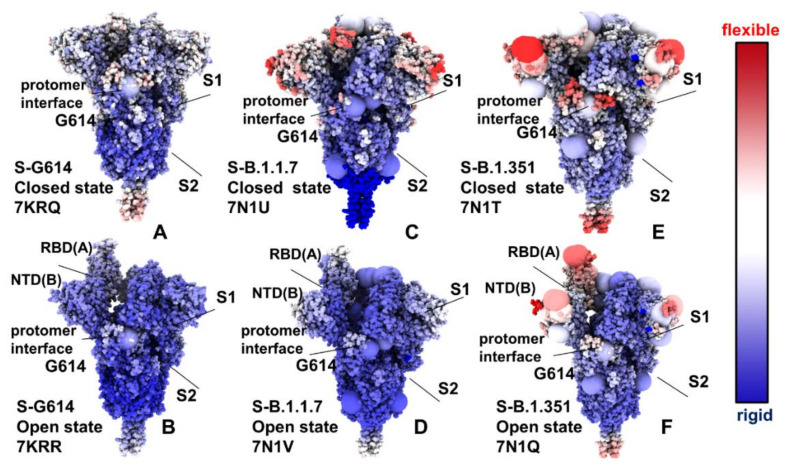
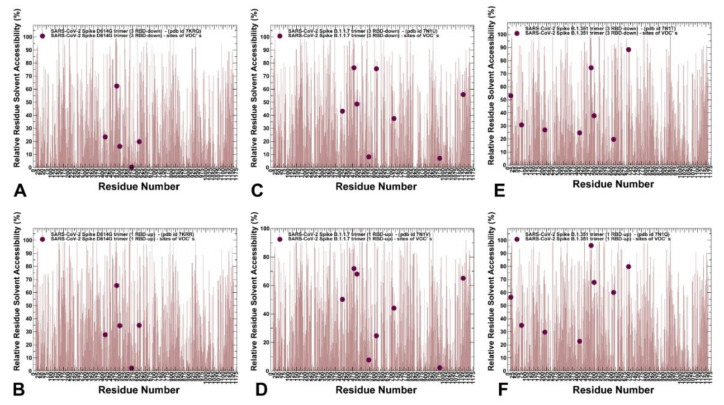
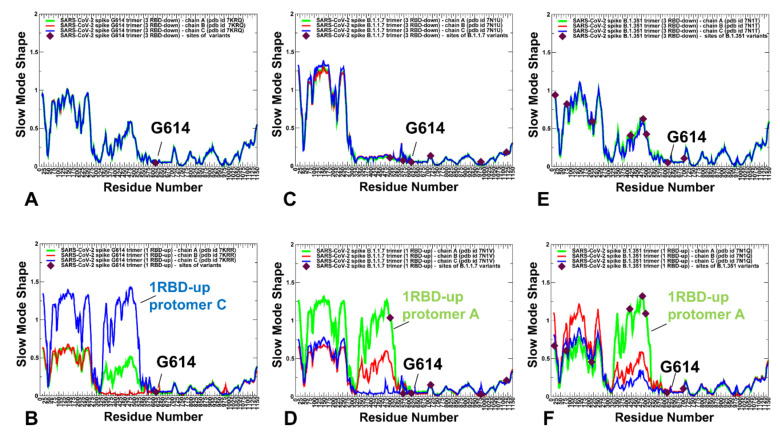
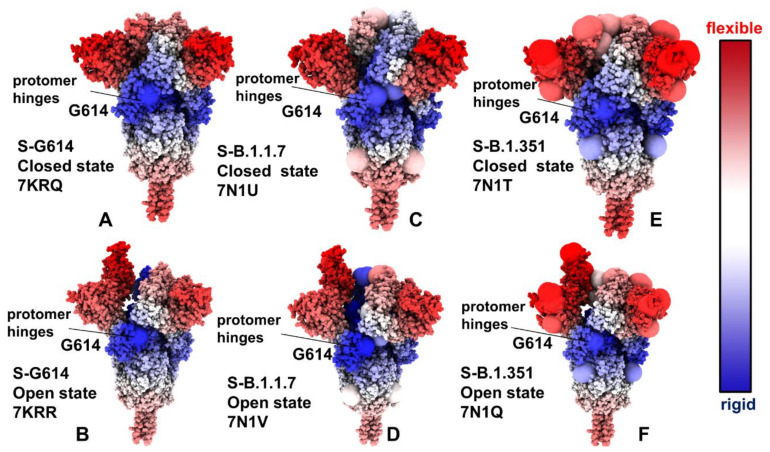
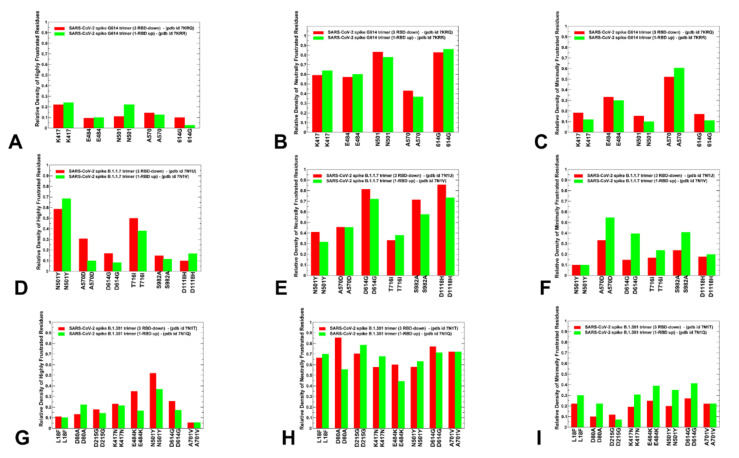
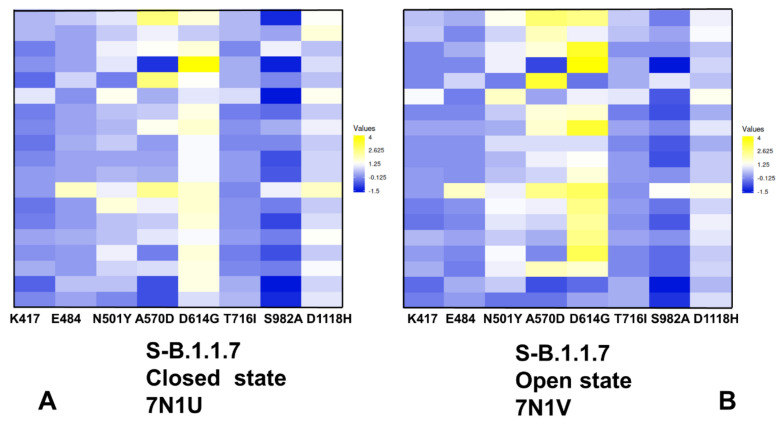
Structural and functional studies of the SARS-CoV-2 spike proteins have recently determined distinct functional states of the B.1.1.7 and B.1.351 spike variants, providing a molecular framework for understanding the mechanisms that link the effect of mutations with the enhanced virus infectivity and transmissibility. A detailed dynamic and energetic analysis of these variants was undertaken in the present work to quantify the effects of different mutations on functional conformational changes and stability of the SARS-CoV-2 spike protein. We employed the efficient and accurate coarse-grained (CG) simulations of multiple functional states of the D614G mutant, B.1.1.7 and B.1.351 spike variants to characterize conformational dynamics of the SARS-CoV-2 spike proteins and identify dynamic signatures of the functional regions that regulate transitions between the closed and open forms. By combining molecular simulations with full atomistic reconstruction of the trajectories and the ensemble-based mutational frustration analysis, we characterized how the intrinsic flexibility of specific spike regions can control functional conformational changes required for binding with the host-cell receptor. Using the residue-based mutational scanning of protein stability, we determined protein stability hotspots and identified potential energetic drivers favoring the receptor-accessible open spike states for the B.1.1.7 and B.1.351 spike variants. The results suggested that modulation of the energetic frustration at the inter-protomer interfaces can serve as a mechanism for allosteric couplings between mutational sites and the inter-protomer hinges of functional motions. The proposed mechanism of mutation-induced energetic frustration may result in greater adaptability and the emergence of multiple conformational states in the open form. This study suggested that SARS-CoV-2 B.1.1.7 and B.1.351 variants may leverage the intrinsic plasticity of functional regions in the spike protein for mutation-induced modulation of protein dynamics and allosteric regulation to control binding with the host cell receptor.

Keywords: ACE2 host receptor; SARS-CoV-2 spike protein; allosteric interactions; conformational dynamics; local frustration; mutational scanning; mutational variants; protein stability.


Conflict of interest statement

The authors declare that the research was conducted in the absence of any commercial or financial relationship that could be construed as a potential conflict of interest. The funders had no role in the design of the study; in the collection, analyses, or interpretation of data; in the writing of the manuscript, or in the decision to publish the results.

Figures

Figure 1
Figure 1
Cryo-EM structures of the SARS-CoV-2 S trimers used in this study. The S-G614 closed state (pdb id 7KRQ) (A) and S-G614 1 RBD-up open form (pdb id 7KRR) (B). The S-B.1.1.7 closed form (pdb id 7N1U) (C) and S-B.1.1.7 1 RBD-up open state (pdb id 7N1V) (D). The S-B.1.351 closed form (pdb id 7N1T) (E) and S-B.1.351 1 RBD-up open state (pdb id 7N1Q) (F). The structures are shown in full spheres and protomers A,B,C are colored in green, red and blue. The sites of mutational variants are shown in enlarged spheres and are colored based on the respective protomer. The mutational sites are D614G for S-G614 structures (panels A,B). The S-B.1.1.7 mutational sites are N501Y, A570D, D614G, P681H, T716I, S982A, and D1118H (panels C,D). The S-B.1.351 mutational sites are L18F, D80A, D215G, R246I, K417N, E484K, N501Y, D614G, and A701V (panels E,F). The rendering of SARS-CoV-2 S structures was performed using the interactive visualization program UCSF ChimeraX [72].
Figure 2
Figure 2
Conformational dynamics profiles obtained from simulations of the SARS-CoV-2 S protein variants. (A) The RMSF profiles obtained from simulations of the cryo-EM structures of SARS-CoV-2 S-G614 in the closed state, pdb id 7KRQ (green lines), S-B.1.1.7 closed form, pdb id 7N1U (blue lines), and S-B.1.351 closed state, pdb id 7N1T (maroon lines). (B) The RMSF profiles obtained from simulations of the cryo-EM structures of S-G614 in the open 1 RBD-up state, pdb id 7KRR (green lines), S-B.1.1.7 open 1 RBD-up form, pdb id 7N1V (blue lines), and S-B.1.351 open 1 RBD-up state, pdb id 7N1Q (maroon lines). The position of the RBM motif is indicated by an arrow. The S1 subunit (residues 14–685) and S2 subunit (residues 686–1163). The S1 domains include NTD (residues 14–306), RBD (residues 331–528), CTD1 (residues 528–591), CTD2 (residues 592–685). The S2 subunit contains upstream helix (UH), fusion peptide (FP), fusion peptide proximal region (FPPR), heptad repeat 1 (HR1), central helix region (CH), connector domain (CD), heptad repeat 2 (HR2), transmembrane domain (TM) and cytoplasmic tail (CT) regions. The S2 domains and functional regions of the simulated structures include UH (residues 736–781), FPPR segment (residues 828–853), HR1 (residues 910–985), CH (residues 986–1035), CD (residues 1035–1068), HR2 (residues 1069–1163).
Figure 3
Figure 3
Structural maps of the conformational mobility RMSF profiles for the SARS-CoV-2 S protein variants. The RMSF profiles used for structural mapping are presented in Figure 2. The structural maps are projected onto the original cryo-EM structures. The conformational dynamics map for the S-G614 closed state (pdb id 7KRQ) (A) and S-G614 1 RBD-up open form (pdb id 7KRR) (B). Structural maps of the conformational mobility for the S-B.1.1.7 in the closed form (pdb id 7N1U) (C) and S-B.1.1.7 in the 1 RBD-up open state (pdb id 7N1V) (D). Structural maps of the conformational mobility for the S-B.1.351 in the closed form (pdb id 7N1T) (E) and S-B.1.351 in the 1 RBD-up open state (pdb id 7N1Q) (F). The sites of mutational variants are shown in enlarged spheres and are colored based on the respective protomer. The mutational sites are D614G for S-G614 structures (panels A,B). The S-B.1.1.7 mutational sites are N501Y, A570D, D614G, P681H, T716I, S982A, and D1118H (panels C,D). The S-B.1.351 mutational sites are L18F, D80A, D215G, R246I, K417N, E484K, N501Y, D614G, and A701V (panels E,F). The structures are in sphere-based representation and are rendered using UCSF ChimeraX [72] with the rigidity-to-flexibility sliding scale colored from blue (highly rigid) to red (highly flexible). The S1 and S2 subunits are indicated by arrows. The NTD(protomer B)-RBD(protomer A) interfaces and inter-protomer interfaces near G614 site are also indicated by arrows, and annotated.
Figure 4
Figure 4
The relative residue-based solvent accessibility profiles for the SARS-CoV-2 S protein variants averaged over simulation trajectories. The absolute Accessible Surface Area (ASA) of each wild-type residue undergoing variation has been computed using the GetArea program [75]. The RSA values are obtained dividing absolute ASA values by residue-specific maximal accessibility values, as extracted from the Sander and Rost scale [76]. The residue-based RSA profiles for the S-G614 closed state (pdb id 7KRQ) (A) and 1 RBD-up open form (pdb id 7KRR) (B). The positions of K417, E484, N501, A570, and D614G are shown in maroon-colored spheres. The RSA profiles for SARS-CoV-2 S-B.1.1.7 closed form (pdb id 7N1U) (C) and 1 RBD-up open state (pdb id 7N1V) (D). The positions of K417, E484, N501Y, A570D, D614G, T716I, S982A, and D1118H are shown in maroon-colored spheres. The RSA profiles for SARS-CoV-2 S-B.1.351 closed form (pdb id 7N1T) (E) and 1 RBD-up open state (pdb id 7N1Q) (F). The positions of L18F, D80A, D215G, K417N, E484K, N501Y, D614G, and A701V are shown in maroon-colored spheres.
Figure 5
Figure 5
The slow mode mobility profiles of the SARS-CoV-2 S trimer structures. Based on the covariance matrix, by conducting PCA, the eigenvalues and the eigenvectors describing the collective protein dynamics modes are obtained. The slow mode shapes represent the displacements along slow mode eigenvectors and correspond to the cumulative contribution of the slowest three modes. The slow mode mobility profiles for the cryo-EM structures of the S-G614 in the closed state, pdb id 7KRQ; (A), S-G614 in the 1 RBD-up state, pdb id 7KRR (B), S-B.1.1.7 in the closed form, pdb id 7N1U (C), S-B.1.1.7 in the o1 RBD-up form, pdb id 7N1V (D), S-B.1.351in the closed state, pdb id 7N1T (E), and S-B.1.351 in the 1 RBD-up state, pdb id 7N1Q (F). The slow mode profiles for protomer chains A, B and C are shown in green, red and blue lines respectively. The 1 RBD-up protomer for the S-G614 open structure corresponds to protomer C (blue lines, panel B), the 1 RBD up protomer for the S-B.1.1.7 open structure corresponds to protomer A (green lines, panel D), and the 1 RBD up protomer for the S-B.1.351 open structure corresponds to protomer A (green lines, panel F). The position of D614G is shown in maroon-colored spheres for S-G614 on panels (A,B). The positions of K417, E484, N501Y, A570D, D614G, T716I, S982A, and D1118H are shown in maroon-colored spheres for S-B.1.1.7 on panels (C,D). The positions of L18F, D80A, D215G, K417N, E484K, N501Y, D614G, and A701V are shown in maroon-colored spheres for S-B.1.351 on panels (E,F).
Figure 6
Figure 6
Structural maps of the slow mode mobility profiles for the SARS-CoV-2 S protein variants. The structural mapping of the slow mode mobility profiles projected onto the cryo-EM structure of S-G614 in the closed state (pdb id 7KRQ) (A) and the cryo-EM structure of S-G614 in the 1 RBD-up open state (pdb id 7KRR) (B). Structural mapping of the slow mode mobility profiles projected onto the cryo-EM structure of S-B.1.1.7 in the closed form (pdb id 7N1U) (C) and the cryo-EM structure of S-B.1.1.7 in the 1 RBD-up open state (pdb id 7N1V) (D). Structural maps of the slow mode mobility profiles are projected onto the cryo-EM structure of S-B.1.351 in the closed form (pdb id 7N1T) (E) and the cryo-EM structure of S-B.1.351 in the 1 RBD-up open state (pdb id 7N1Q) (F). The structural mapping is based on the computed cumulative contribution of the slowest three dynamics modes to the mobility of residues, as presented in Figure 5. The sites of mutational variants are shown in enlarged spheres and are colored based on the respective protomer. The mutational sites are D614G for S-G614 structures (panels A,B). The S-B.1.1.7 mutational sites are N501Y, A570D, P681H, T716I, S982A, and D1118H (panels C,D). The S-B.1.351 mutational sites are L18F, D80A, D215G, R246I, K417N, E484K, N501Y, D614G, and A701V (panels E,F). The structures are in sphere-based representation and are rendered using UCSF ChimeraX [72] with the rigidity-to-flexibility sliding scale colored blue (highly rigid) to red (highly flexible). The inter-protomer interfaces and hinge near G614 site are indicated by arrows, and annotated.
Figure 7
Figure 7
A comparison of the ensemble-averaged local mutational frustration between closed and open forms for sites of mutational variants and hinge positions of the S-G614 variant (AC), S-B.1.1.7 variant (DF) and S-B.1.351 variant (GI). The relative densities of highly frustrated, neutrally frustrated and minimally frustrated residues are shown. The relative density index is shown in red bars for the closed states and in green bars for the open states.
Figure 8
Figure 8
Ensemble-based mutational profiling of the SARS-CoV-2 S-B.1.1.7 protein stability. The mutational scanning heatmaps are shown for the closed state (A) and open state (B). The heatmaps show the computed binding free-energy changes for 19 single mutations on the sites of variants. The squares on the heatmap are colored using a 3-colored scale—from blue to white and to yellow, with yellow indicating the largest unfavorable effect on stability. The standard errors of the mean for binding free-energy changes were based on five independent CG trajectories for each of the S-B.1.1.7 states and different number of selected samples from a given trajectory (500, 1000 and 2000 samples) are ~0.11–0.24 kcal/mol using averages over different trajectories and ≤0.15 kcal/mol from computations based on different number of samples from a single trajectory.
Figure 9
Figure 9
Ensemble-based mutational profiling of the SARS-CoV-2 S-B.1.351 protein stability. The mutational scanning heatmaps are shown for the closed state (A) and open state (B). The heatmaps show the computed binding free-energy changes for 19 single mutations on the sites of variants. The squares on the heatmap are colored using a 3-colored scale—from blue to white and to yellow, with yellow indicating the largest unfavorable effect on stability. The standard errors of the mean for binding free energy changes were based on five independent CG trajectories for each of the S-B.1.351 states and different number of selected samples from a given trajectory (500, 1000 and 2000 samples) are ~0.18–0.27 kcal/mol using averages over different trajectories and ≤0.17 kcal/mol from computations based on different number of samples from a single trajectory.

Similar articles

Cited by

References

    1. Tai W., He L., Zhang X., Pu J., Voronin D., Jiang S., Zhou Y., Du L. Characterization of the receptor-binding domain (RBD) of 2019 novel coronavirus: Implication for development of RBD protein as a viral attachment inhibitor and vaccine. Cell. Mol. Immunol. 2020;17:613–620. doi: 10.1038/s41423-020-0400-4. - DOI - PMC - PubMed
    1. Wang Q., Zhang Y., Wu L., Niu S., Song C., Zhang Z., Lu G., Qiao C., Hu Y., Yuen K.Y., et al. Structural and functional basis of SARS-CoV-2 entry by using human ACE2. Cell. 2020;181:894–904.e9. doi: 10.1016/j.cell.2020.03.045. - DOI - PMC - PubMed
    1. Walls A.C., Park Y.J., Tortorici M.A., Wall A., McGuire A.T., Veesler D. Structure, Function, and Antigenicity of the SARS-CoV-2 Spike Glycoprotein. Cell. 2020;181:281–292.e6. doi: 10.1016/j.cell.2020.02.058. - DOI - PMC - PubMed
    1. Wrapp D., Wang N., Corbett K.S., Goldsmith J.A., Hsieh C.L., Abiona O., Graham B.S., McLellan J.S. Cryo-EM structure of the 2019-nCoV spike in the prefusion conformation. Science. 2020;367:1260–1263. doi: 10.1126/science.abb2507. - DOI - PMC - PubMed
    1. Cai Y., Zhang J., Xiao T., Peng H., Sterling S.M., Walsh R.M., Jr., Rawson S., Rits-Volloch S., Chen B. Distinct conformational states of SARS-CoV-2 spike protein. Science. 2020;369:1586–1592. doi: 10.1126/science.abd4251. - DOI - PMC - PubMed

Substances

Supplementary concepts