. 2022 Jan 31;23(3):1681.
doi: 10.3390/ijms23031681.

Functional Characterization of Tomato Phytochrome A and B1B2 Mutants in Response to Heat Stress

Affiliations

Functional Characterization of Tomato Phytochrome A and B1B2 Mutants in Response to Heat Stress

Islam M Y Abdellatif et al. Int J Mol Sci. .

Abstract

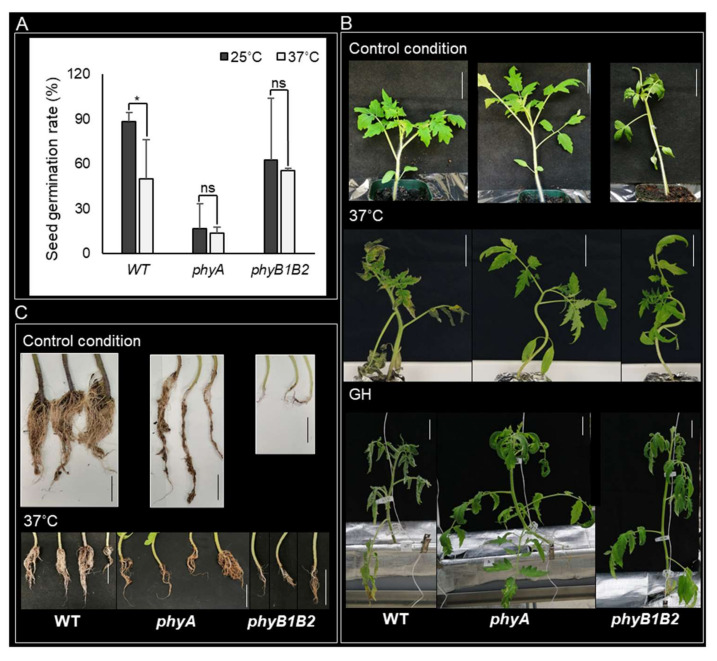
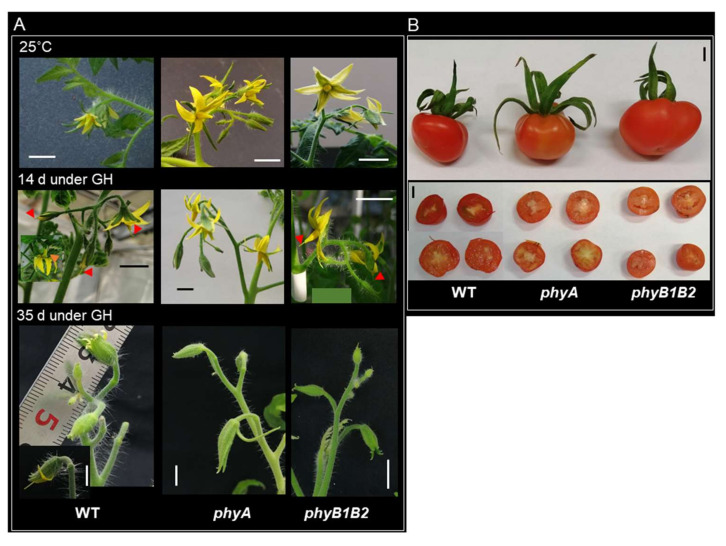
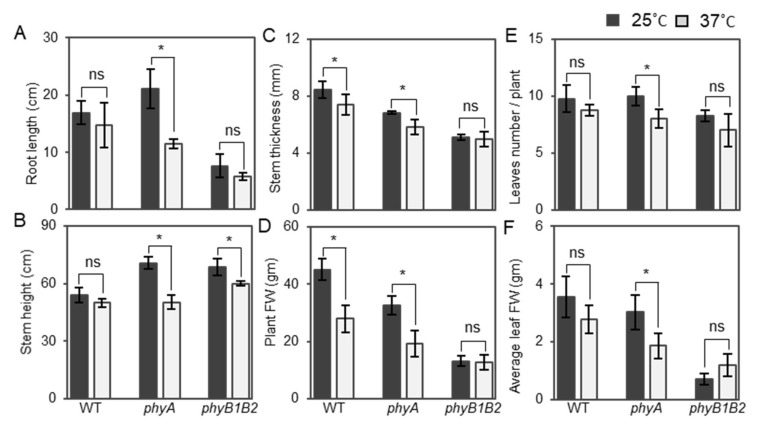
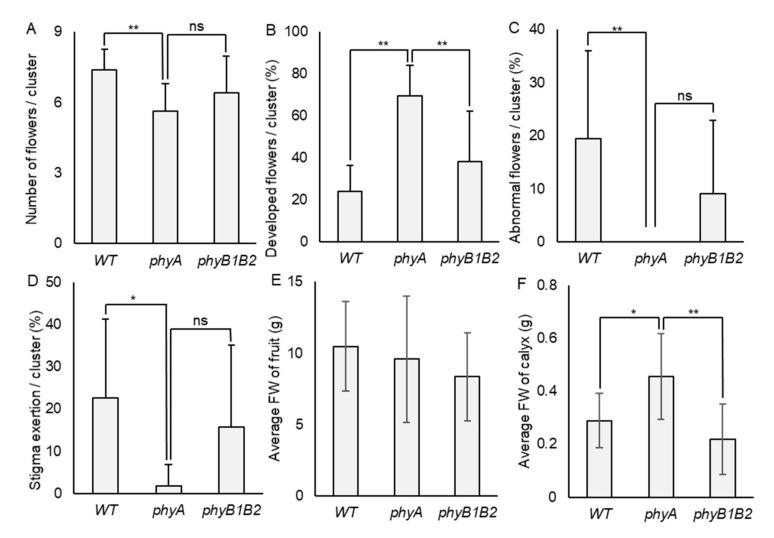
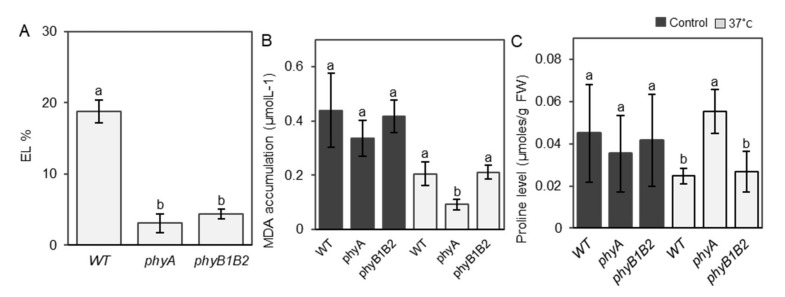
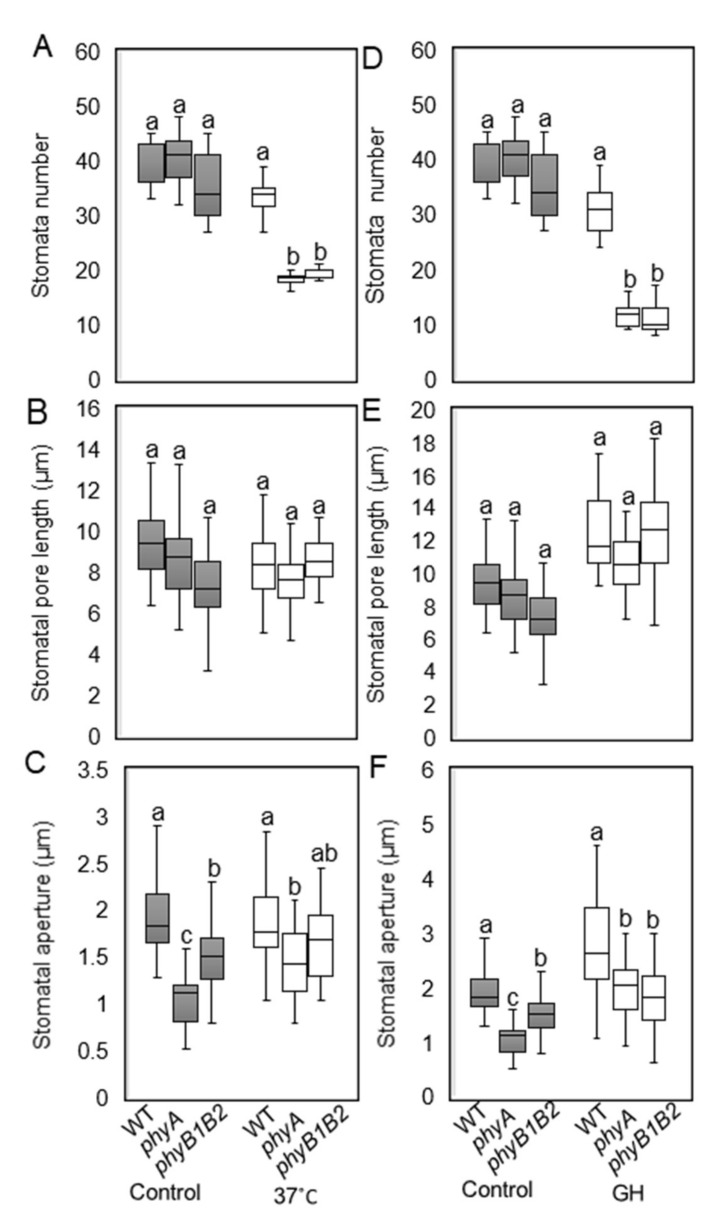
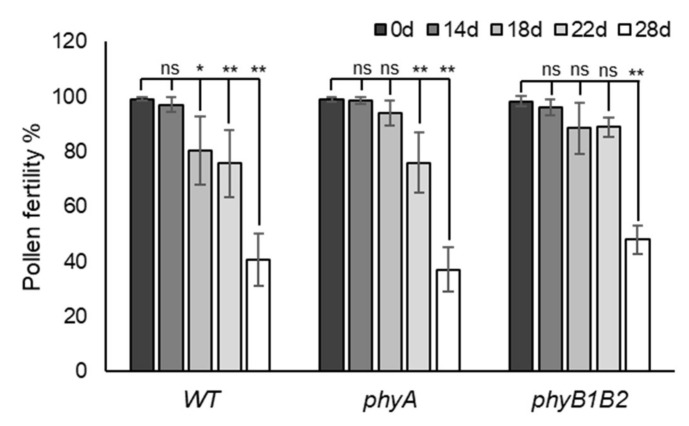
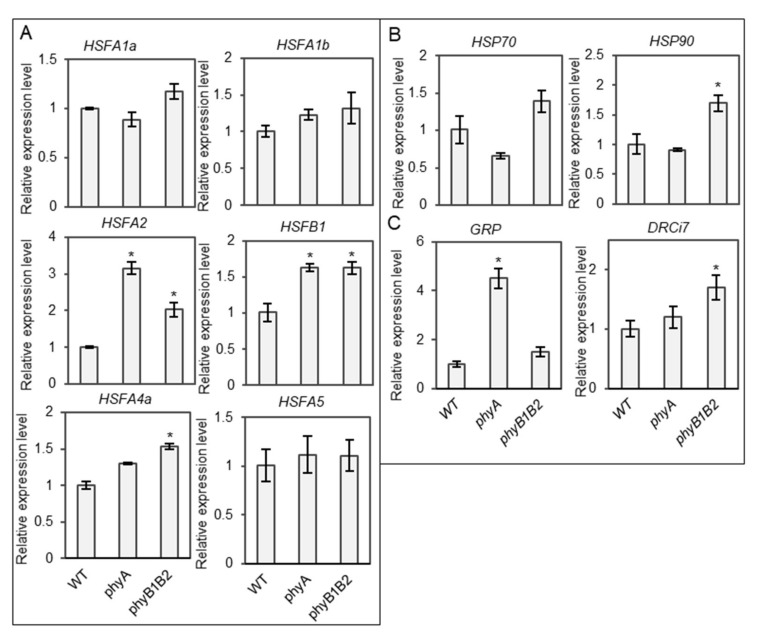
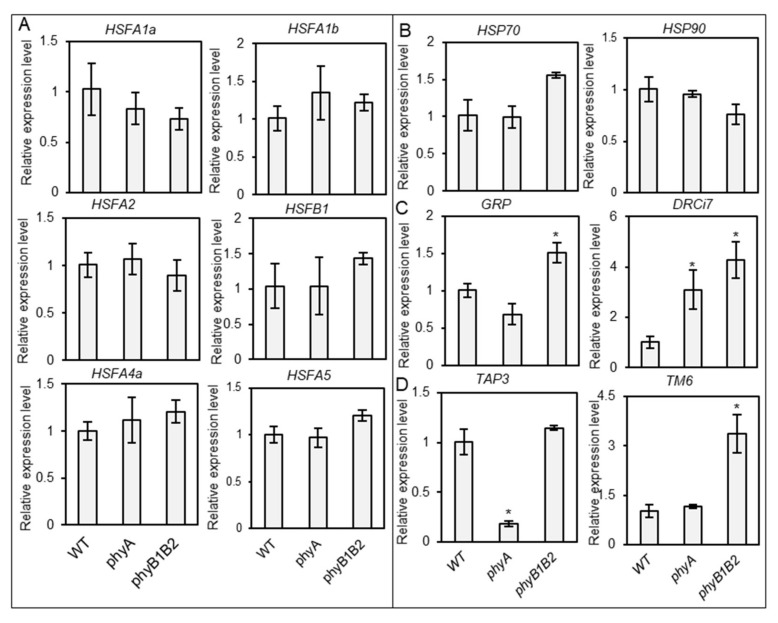
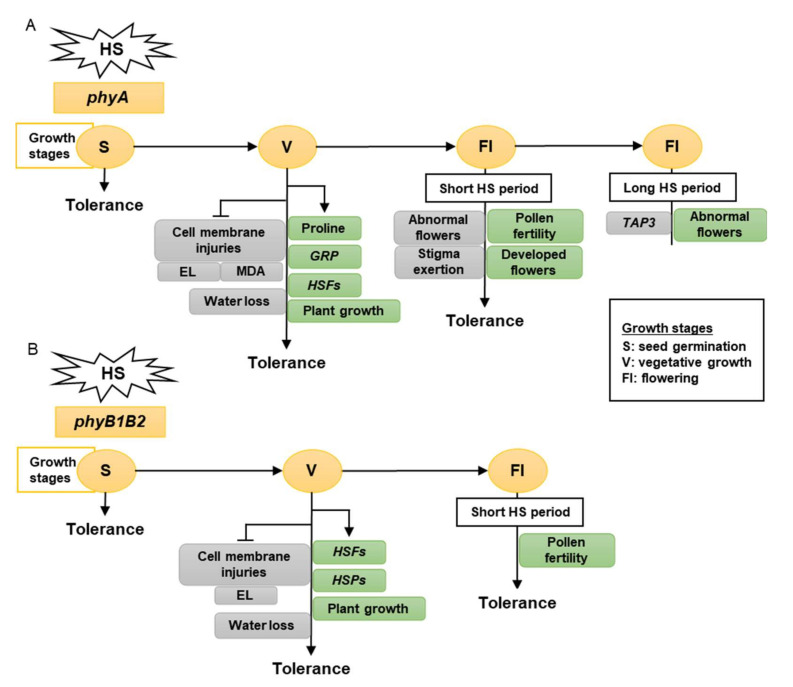
Heat stress (HS) is a prevalent negative factor affecting plant growth and development, as it is predominant worldwide and threatens agriculture on a large scale. PHYTOCHROMES (PHYs) are photoreceptors that control plant growth and development, and the stress signaling response partially interferes with their activity. PHYA, B1, and B2 are the most well-known PHY types in tomatoes. Our study aimed to identify the role of tomato 'Money Maker' phyA and phyB1B2 mutants in stable and fluctuating high temperatures at different growth stages. In the seed germination and vegetative growth stages, the phy mutants were HS tolerant, while during the flowering stage the phy mutants revealed two opposing roles depending on the HS exposure period. The response of the phy mutants to HS during the fruiting stage showed similarity to WT. The most obvious stage that demonstrated phy mutants' tolerance was the vegetative growth stage, in which a high degree of membrane stability and enhanced water preservation were achieved by the regulation of stomatal closure. In addition, both mutants upregulated the expression of heat-responsive genes related to heat tolerance. In addition to lower malondialdehyde accumulation, the phyA mutant enhanced proline levels. These results clarified the response of tomato phyA and phyB1B2 mutants to HS.

Keywords: HS; PHYTOCHROME A; PHYTOCHROME B1B2; heat tolerance; phyA; phyB1B2; tomato.


Conflict of interest statement

H.H. is employed by Kaneka Corporation. H.E. and K.M. received research support from Kaneka Corporation. The remaining authors declare that the research was conducted in the absence of any commercial or financial relationships that could be construed as a potential conflict of interest.

Figures

Figure 1
Figure 1
Plant features during seed germination and vegetative growth stages under heat stress (HS). (A) The seed germination rate of WT, phyA, and phyB1B2 after 7 days at 25 or 37 °C. (B) The phenotype of 4-week-old plants of tomato WT and phyA and phyB1B2 mutants under control conditions at 25 °C and after exposure to HS at 37 °C or fluctuating high temperature in greenhouse (GH) conditions for 2 weeks. (C) Root phenotype of 4-week-old plants of WT and phyA and phyB1B2 mutants after 2 weeks under control conditions at 25 °C or HS at 37 °C. The scale bars represent 5 cm. Values represent the means ± SD (n ≥ 10) from a representative of three biological replicates. The asterisk symbol (*) represents statistically significant differences (p < 0.05), while ns represents statistically nonsignificant differences, between each genotype individually under 25 and 37 °C according to one-way ANOVA with post hoc Tukey HSD test.
Figure 2
Figure 2
Flower and fruit phenotypic response under heat stress (HS). (A) The flower phenotype of WT, phyA, and phyB1B2 under 25 °C and high-temperature stress under greenhouse (GH) conditions for 14 or 35 days. (B) Fruit phenotype and parthenocarpic phenomena of WT, phyA, and phyB1B2 under GH conditions. The scale bar represents 1 cm.
Figure 3
Figure 3
Root length and plant vegetative characteristics under heat stress (HS). Root length (A), plant stem height (B), stem thickness (C), plant FW (D), number of leaves/plant (E), and average leaf FW (F) of WT and phyA and phyB1B2 mutants after exposing 4-week-old plants to HS conditions at 37 °C for 2 weeks in comparison with control conditions at 25 °C. Values represent the means ± SD (n = 4) from a representative of three biologically independent experiments. The asterisk symbol (*) represents statistically significant differences, while ns represents statistically nonsignificant differences, between each genotype individually under control and HS conditions according to Duncan’s test (p < 0.05).
Figure 4
Figure 4
Flower and fruit characteristics under heat stress (HS). (A) The number of flowers/cluster, (B) the percentage of developed flowers/cluster, (C) the percentage of abnormal flowers/cluster (that showed antheridia cone splitting), and (D) the percentage of stigma exertion/cluster were detected in WT, phyA, and phyB1B2 plants exposed to fluctuating high temperature for 14 days during flowering stage. (E) The average FW of fruit and (F) the average FW of calyx of WT, phyA, and phyB1B2 were recorded under greenhouse (GH) conditions. The average temperature is recorded in Figure S1. The minimum Tm was 17.0 °C while the maximum was 50.5 °C. Data represent the means ± SD (n ≥ 8). The asterisk symbol (*) represents statistically significant differences (p < 0.05), double asterisk symbol (**) expresses statistically highly significant differences (p < 0.01), and ns abbreviation represents statistically nonsignificant differences between all genotypes under HS conditions according to one-way ANOVA with post hoc Tukey HSD test.
Figure 5
Figure 5
Electrolyte leakage (EL), MDA accumulation, and proline level under heat stress (HS). (A) The leaf EL of WT, phyA, and phyB1B2 after 2 weeks of HS at 37 °C. Values represent the means ± SD (n = 6) from a representative of three biologically independent experiments. MDA accumulation (B) and proline level (C) of WT and phyA and phyB1B2 mutants under 25 and 37 °C. Data represent the means ± SD (n ≥ 4) from a representative of three biologically independent experiments. The letters written on the top of the error bars show the statistically significant differences between WT and phy mutants under HS conditions for EL parameter and under control and HS conditions individually for MDA and proline parameters, according to Duncan’s test (p < 0.05). The same letter indicates no significant difference.
Figure 6
Figure 6
Microscopic analysis of stomata features under heat stress (HS). Stomata number/92.7mm2 (A,D), stomatal pore length (μm) (B,E), and stomatal aperture (μm) (C,F) after 2 weeks under HS at 37 °C and greenhouse (GH) conditions were investigated in comparison with control conditions at 25 °C. The boxplot values represent the recorded data (n ≥ 10) from a representative of three biologically independent experiments. The letters written on the top of the boxplots show the statistically significant differences between WT and phy mutants under control and HS conditions individually according to Duncan’s test (p < 0.05). The same letter indicates no significant difference.
Figure 7
Figure 7
Pollen fertility under heat stress (HS). The pollen fertility percentage of WT, phyA, and phyB1B2 after 0, 14, 18, 22, and 28 days of HS under greenhouse (GH) conditions. Data represent the means ± SD (n = 4). The asterisk symbol (*) represents statistically significant differences (p < 0.05), double asterisk symbol (**) expresses statistically highly significant differences (p < 0.01), and ns abbreviation represents statistically nonsignificant differences between each genotype individually after 0, 14, 18, 22, and 28 days of HS according to one-way ANOVA with post hoc Tukey HSD test.
Figure 8
Figure 8
Relative gene expression levels under heat stress (HS) during vegetative growth stage. The expression levels of HSFs (HSFA1a, HSFA1b, HSFA2, HSFB1, HSFA4a, and HSFA5) (A), HSPs (HSP70 and HSP90) (B), and stress-responsive genes (GRP and DRCi7) (C) of one-month-old plants of WT and phyA and phyB1B2 mutants after 2 weeks under HS at 37 °C. The relative expression level of the WT was normalized to 1. Error bars represent standard deviation (n = 3). The asterisk symbol (*) represents statistically significant differences between WT and phy mutants using Duncan’s test (p < 0.05).
Figure 9
Figure 9
Relative gene expression level under heat stress (HS) during the flowering stage. The expression level of HSFs (HSFA1a, HSFA1b, HSFA2, HSFB1, HSFA4a, and HSFA5) (A), HSPs (HSP70 and HSP90) (B), and stress-responsive genes (GRP and DRCi7) (C) of WT and phyA and phyB1B2 mutants after one month under HS at 37 °C during the flowering stage. Flower-related genes (TAP3 and TM6) (D) were observed after 35 days under greenhouse (GH) conditions when plants showed abnormal flower structures. The relative expression level of the WT was normalized to 1. Error bars represent standard deviation (n ≥ 3). The asterisk symbol (*) represents statistically significant differences between WT and phy mutants using Duncan’s test (p < 0.05).
Figure 10
Figure 10
The model shows the response of phyA (A) and phyB1B2 (B) mutations at different growth stages under heat stress (HS). The gray rectangles show the factors inhibited while the green rectangles illustrate the factors enhanced by stress application. The growth stages that were shortened in S, V, and Fl were the seed germination, vegetative growth, and flowering stages, respectively. The phy mutants exhibited tolerance to HS during S, V, and Fl stages. In S stage, the seed germination rates of both phy mutants were not significantly affected by HS compared to control conditions (A, B). In V stage, phyA enhanced the proline production, HSFs, GRP, and plant growth (A), while phyB1B2 enhanced the upregulation of HSFs and HSPs as well as plant growth (B). In addition, both phy mutants inhibited cell membrane injuries (A, B). In Fl stage, phy mutants enhanced pollen fertility for a longer time compared to WT (A, B). Moreover, phyA exhibited an increase in the percentage of developed flowers and an inhibition in the percentage of abnormal and stigma-exerted flowers compared to WT. During a long HS application in the Fl stage, phyA exhibited enhanced abnormal flower formation via downregulation of TAP3 which enhanced sepal and petal conversion (A).

Similar articles

Cited by

References

    1. Zhou R., Yu X., Ottosen C.-O., Rosenqvist E., Zhao L., Wang Y., Yu W., Zhao T., Wu Z. Drought Stress Had a Predominant Effect over Heat Stress on Three Tomato Cultivars Subjected to Combined Stress. BMC Plant Biol. 2017;17:1–13. doi: 10.1186/s12870-017-0974-x. - DOI - PMC - PubMed
    1. Wang D., Heckathorn S.A., Mainali K., Tripathee R. Timing Effects of Heat-Stress on Plant Ecophysiological Characteristics and Growth. Front. Plant Sci. 2016;7:1629. doi: 10.3389/fpls.2016.01629. - DOI - PMC - PubMed
    1. Wahid A., Gelani S., Ashraf M., Foolad M.R. Heat Tolerance in Plants: An Overview. Environ. Exp. Bot. 2007;61:199–223. doi: 10.1016/j.envexpbot.2007.05.011. - DOI
    1. Silva R.S., Kumar L., Shabani F., Picanço M.C. Assessing the Impact of Global Warming on Worldwide Open Field Tomato Cultivation through CSIRO-Mk3·0 Global Climate Model. J. Agric. Sci. 2017;155:407–420. doi: 10.1017/S0021859616000654. - DOI
    1. Zhou R., Yu X., Zhao T., Ottosen C.-O., Rosenqvist E., Wu Z. Physiological Analysis and Transcriptome Sequencing Reveal the Effects of Combined Cold and Drought on Tomato Leaf. BMC Plant Biol. 2019;19:1–14. doi: 10.1186/s12870-019-1982-9. - DOI - PMC - PubMed

LinkOut - more resources