

Fisetin Deters Cell Proliferation, Induces Apoptosis, Alleviates Oxidative Stress and Inflammation in Human Cancer Cells, HeLa
- PMID: 35163629
- PMCID: PMC8835995
- DOI: 10.3390/ijms23031707
Fisetin Deters Cell Proliferation, Induces Apoptosis, Alleviates Oxidative Stress and Inflammation in Human Cancer Cells, HeLa
Abstract
Background: Fisetin, a flavonol profusely found in vegetables and fruits, exhibited a myriad of properties in preclinical studies to impede cancer growth.
Purpose: This study was proposed to delineate molecular mechanisms through analysing the modulated expression of various molecular targets in HeLa cells involved in proliferation, apoptosis and inflammation.
Methods: MTT assay, flow cytometry, nuclear morphology, DNA fragmentation and Annexin-Pi were performed to evaluate the anti-cancer potential of fisetin. Furthermore, qPCR and proteome profiler were performed to analyse the expression of variety of gene related to cell death, cell proliferation, oxidative stress and inflammation and cancer pathways.
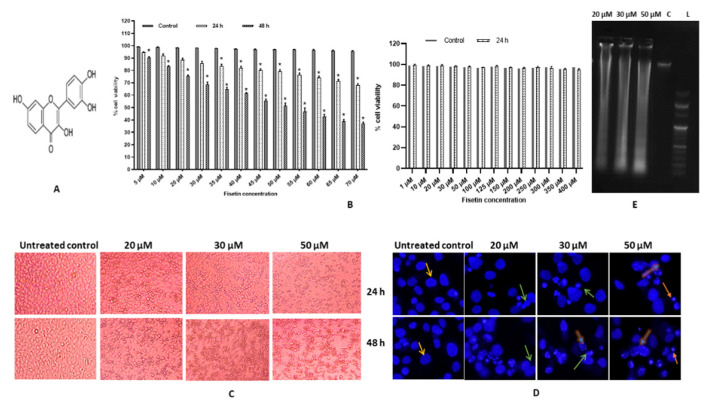
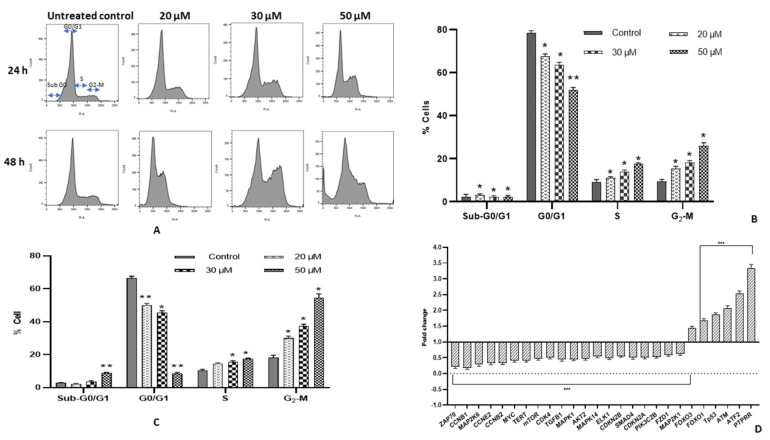
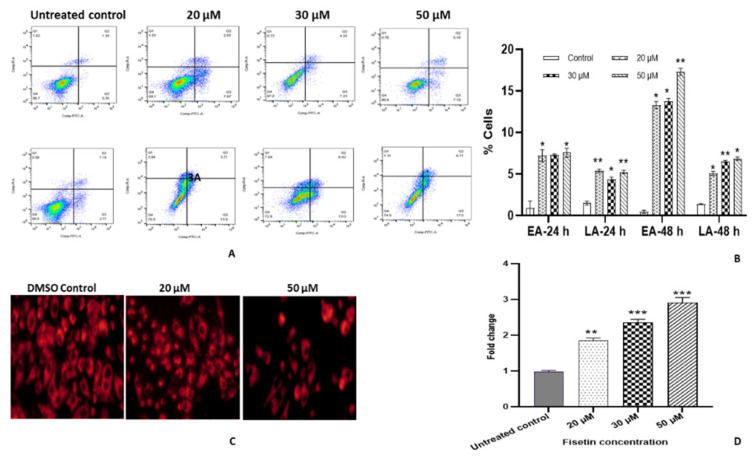
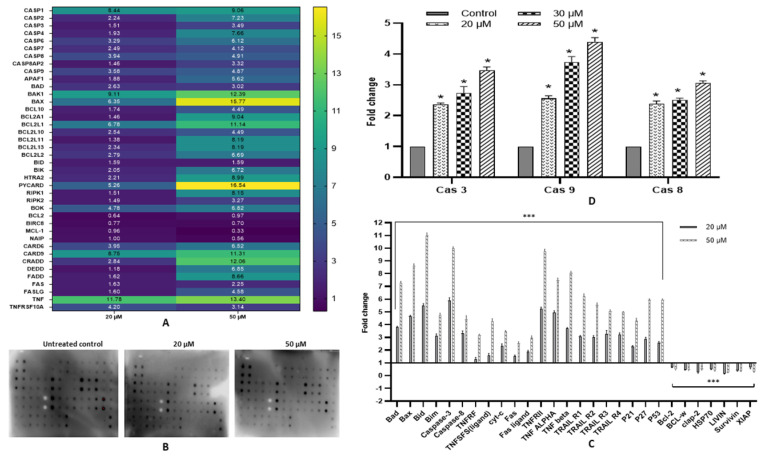
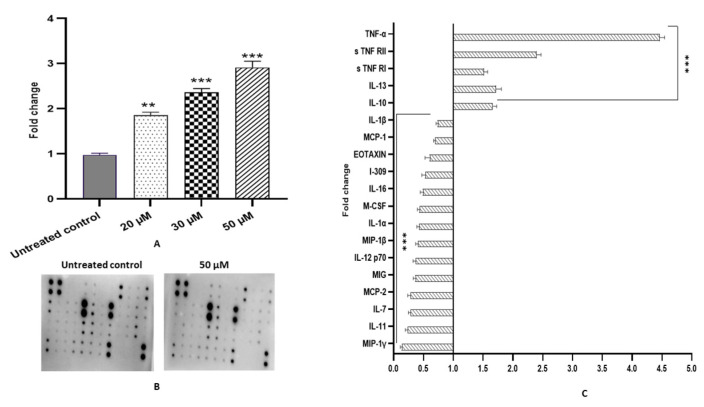
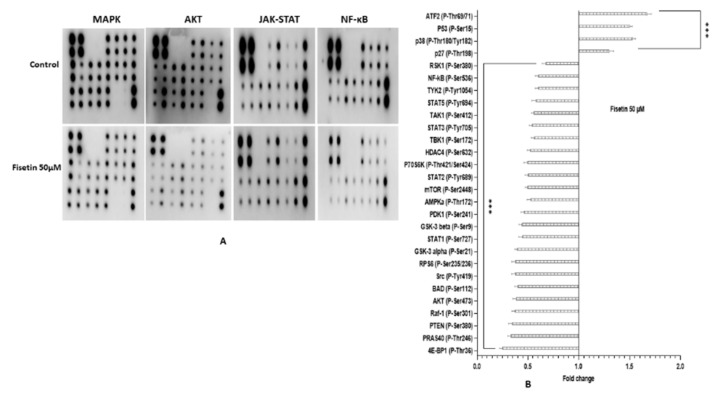
Results: Fisetin demonstrated apoptotic inducing ability in HeLa cells, which was quite evident through nuclear morphology, DNA ladder pattern, decreased TMRE fluorescent intensity, cell cycle arrest at G2/M and increased early and late apoptosis. Furthermore, fisetin treatment modulated pro-apoptotic genes such as APAF1, Bad, Bax, Bid and BIK at both transcript and protein levels and anti-apoptotic gene Bcl-2, BIRC8, MCL-1, XIAP/BIRC4, Livin/BIRC7, clap-2/BIRC3, etc. at protein levels to mitigate cell proliferation and induce apoptosis. Interestingly, the aforementioned alterations consequently led to an elevated level of Caspase-3, Caspase-8 and Caspase-9, which was found to be consistent with the transcript and protein level expression. Moreover, fisetin downregulated the expression of AKT and MAPK pathways to avert proliferation and enhance apoptosis of cancer cells. Fisetin treatment also improves oxidative stress and alleviates inflammation by regulating JAK-STAT/NF-kB pathways.
Conclusion: Together, these studies established that fisetin deters human cervical cancer cell proliferation, enhances apoptosis and ameliorates inflammation through regulating various signalling pathways that may be used as a therapeutic regime for better cancer management.
Keywords: AKT/mTOR; JAK-STAT/NF-kB; MAPK; cytotoxicity; fisetin; glutathione; phosphorylation.
Conflict of interest statement
The authors declare that there is no conflict of interest. The authors declare that there are no competing interests associated with the manuscript.
Figures
Similar articles
-
Fisetin inhibits laryngeal carcinoma through regulation of AKT/NF-κB/mTOR and ERK1/2 signaling pathways.Biomed Pharmacother. 2016 Oct;83:1164-1174. doi: 10.1016/j.biopha.2016.08.035. Epub 2016 Aug 20. Biomed Pharmacother. 2016. PMID: 27551764
-
Chrysin inhibits propagation of HeLa cells by attenuating cell survival and inducing apoptotic pathways.Eur Rev Med Pharmacol Sci. 2021 Mar;25(5):2206-2220. doi: 10.26355/eurrev_202103_25253. Eur Rev Med Pharmacol Sci. 2021. PMID: 33755959
-
Kaempferol and Fisetin-Related Signaling Pathways Induce Apoptosis in Head and Neck Cancer Cells.Cells. 2023 Jun 6;12(12):1568. doi: 10.3390/cells12121568. Cells. 2023. PMID: 37371038 Free PMC article.
-
A comprehensive view on the fisetin impact on colorectal cancer in animal models: Focusing on cellular and molecular mechanisms.Animal Model Exp Med. 2024 Oct;7(5):591-605. doi: 10.1002/ame2.12476. Epub 2024 Aug 13. Animal Model Exp Med. 2024. PMID: 39136058 Free PMC article. Review.
-
Fisetin as a chemoprotective and chemotherapeutic agent: mechanistic insights and future directions in cancer therapy.Med Oncol. 2025 Mar 12;42(4):104. doi: 10.1007/s12032-025-02664-x. Med Oncol. 2025. PMID: 40074915 Review.
Cited by
-
Role of Fisetin in Selected Malignant Neoplasms in Women.Nutrients. 2023 Nov 5;15(21):4686. doi: 10.3390/nu15214686. Nutrients. 2023. PMID: 37960338 Free PMC article. Review.
-
Designing fisetin nanocrystals for enhanced in cellulo anti-angiogenic and anticancer efficacy.Int J Pharm X. 2022 Nov 9;4:100138. doi: 10.1016/j.ijpx.2022.100138. eCollection 2022 Dec. Int J Pharm X. 2022. PMID: 36405872 Free PMC article.
-
Mitochondrial Aging and Senolytic Natural Products with Protective Potential.Int J Mol Sci. 2022 Dec 19;23(24):16219. doi: 10.3390/ijms232416219. Int J Mol Sci. 2022. PMID: 36555859 Free PMC article. Review.
-
Delineating the Antiapoptotic Property of Apigenin as an Antitumor Agent: A Computational and In Vitro Study on HeLa Cells.ACS Omega. 2024 May 30;9(23):24751-24760. doi: 10.1021/acsomega.4c01300. eCollection 2024 Jun 11. ACS Omega. 2024. PMID: 38882173 Free PMC article.
-
The Therapeutic Effects of Bioactive Compounds on Colorectal Cancer via PI3K/Akt/mTOR Signaling Pathway: A Critical Review.Food Sci Nutr. 2024 Nov 7;12(12):9951-9973. doi: 10.1002/fsn3.4534. eCollection 2024 Dec. Food Sci Nutr. 2024. PMID: 39723045 Free PMC article. Review.
References
MeSH terms
Substances
Grants and funding
LinkOut - more resources
Full Text Sources
Medical
Research Materials
Miscellaneous
