

The Effects of αvβ3 Integrin Blockage in Breast Tumor and Endothelial Cells under Hypoxia In Vitro
- PMID: 35163668
- PMCID: PMC8835904
- DOI: 10.3390/ijms23031745
The Effects of αvβ3 Integrin Blockage in Breast Tumor and Endothelial Cells under Hypoxia In Vitro
Abstract
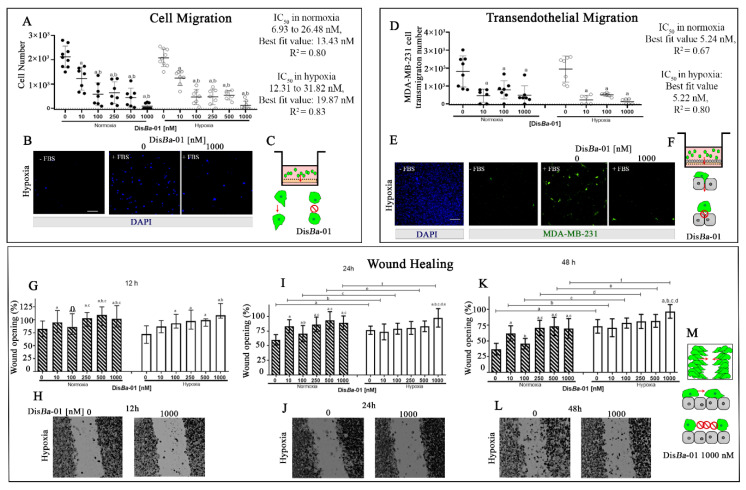
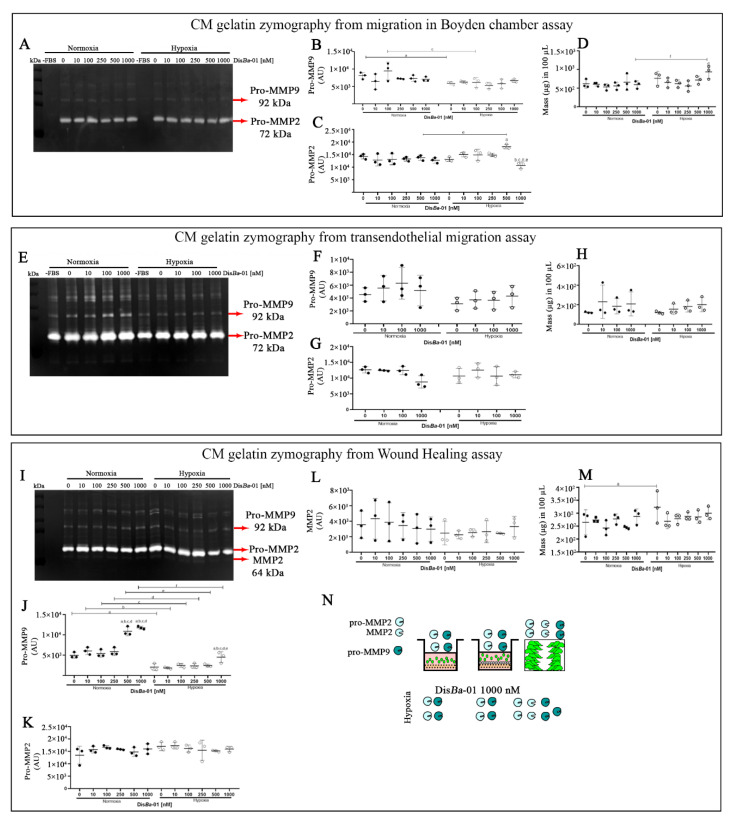
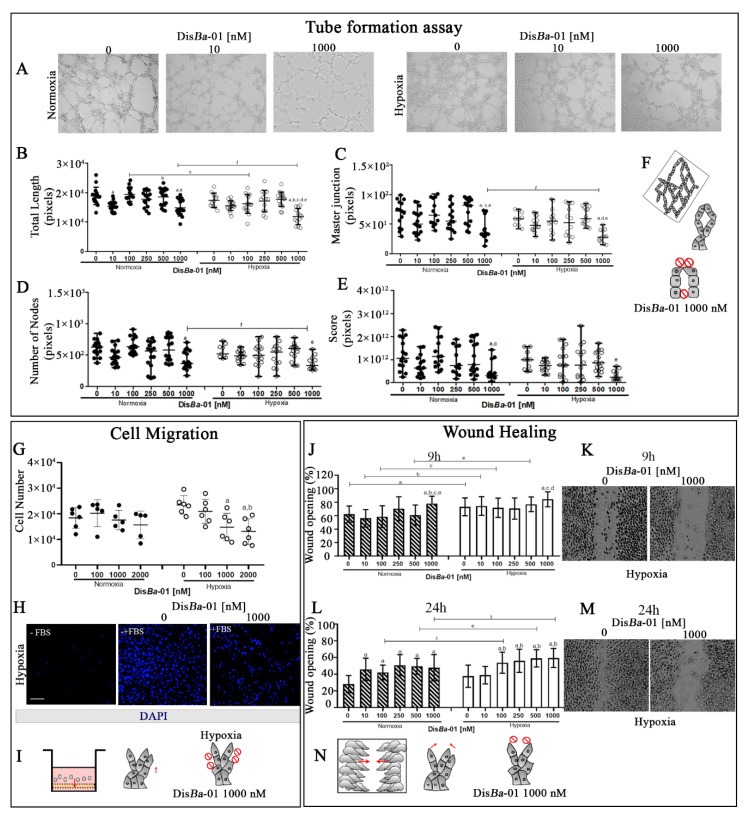
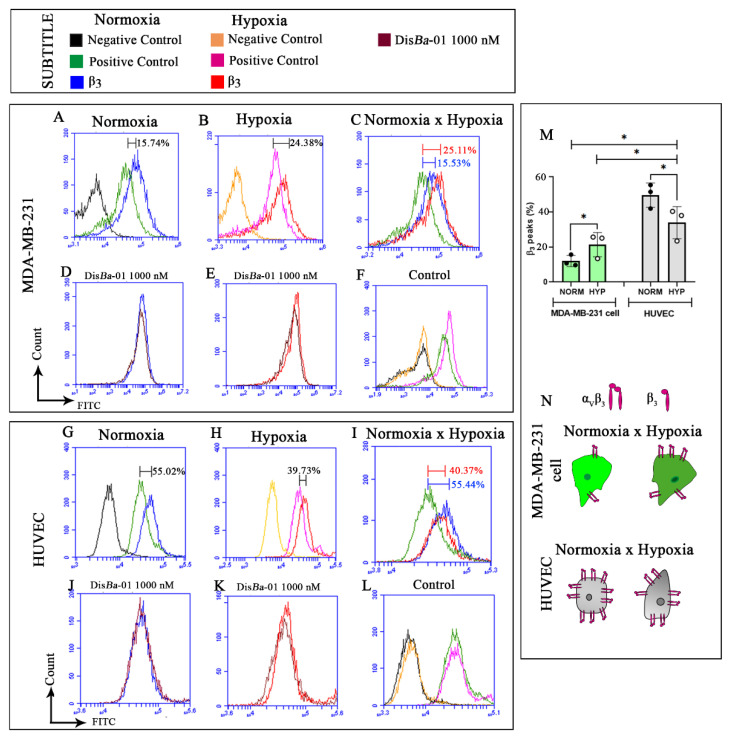
Breast cancer is characterized by a hypoxic microenvironment inside the tumor mass, contributing to cell metastatic behavior. Hypoxia induces the expression of hypoxia-inducible factor (HIF-1α), a transcription factor for genes involved in angiogenesis and metastatic behavior, including the vascular endothelial growth factor (VEGF), matrix metalloproteinases (MMPs), and integrins. Integrin receptors play a key role in cell adhesion and migration, being considered targets for metastasis prevention. We investigated the migratory behavior of hypoxia-cultured triple-negative breast cancer cells (TNBC) and endothelial cells (HUVEC) upon αvβ3 integrin blocking with DisBa-01, an RGD disintegrin with high affinity to this integrin. Boyden chamber, HUVEC transmigration, and wound healing assays in the presence of DisBa-01 were performed in hypoxic conditions. DisBa-01 produced similar effects in the two oxygen conditions in the Boyden chamber and transmigration assays. In the wound healing assay, hypoxia abolished DisBa-01's inhibitory effect on cell motility and decreased the MMP-9 activity of conditioned media. These results indicate that αvβ3 integrin function in cell motility depends on the assay and oxygen levels, and higher inhibitor concentrations may be necessary to achieve the same inhibitory effect as in normoxia. These versatile responses add more complexity to the role of the αvβ3 integrin during tumor progression.
Keywords: DisBa-01; breast tumor; cell migration; disintegrin; hypoxia; αvβ3 integrin blocking.
Conflict of interest statement
The authors declare no conflict of interest.
Figures
Similar articles
-
Recombinant RGD-disintegrin DisBa-01 blocks integrin αvβ3 and impairs VEGF signaling in endothelial cells.Cell Commun Signal. 2019 Mar 20;17(1):27. doi: 10.1186/s12964-019-0339-1. Cell Commun Signal. 2019. PMID: 30894182 Free PMC article.
-
Blocking αvβ3 integrin by a recombinant RGD disintegrin impairs VEGF signaling in endothelial cells.Biochimie. 2012 Aug;94(8):1812-20. doi: 10.1016/j.biochi.2012.04.020. Epub 2012 Apr 27. Biochimie. 2012. PMID: 22561350
-
Blockage of αvβ3 integrin in 3D culture of triple-negative breast cancer and endothelial cells inhibits migration and discourages endothelial-to-mesenchymal plasticity.Biochem Biophys Rep. 2024 Mar 17;38:101686. doi: 10.1016/j.bbrep.2024.101686. eCollection 2024 Jul. Biochem Biophys Rep. 2024. PMID: 38524278 Free PMC article.
-
αvβ3 Integrin and tumour blood vessels-learning from the past to shape the future.Curr Opin Cell Biol. 2016 Oct;42:121-127. doi: 10.1016/j.ceb.2016.07.008. Epub 2016 Jul 27. Curr Opin Cell Biol. 2016. PMID: 27474973 Review.
-
Genes involved in breast cancer metastasis to bone.Cell Mol Life Sci. 2002 Sep;59(9):1491-502. doi: 10.1007/s00018-002-8524-5. Cell Mol Life Sci. 2002. PMID: 12440771 Free PMC article. Review.
Cited by
-
Interaction of Drug-Sensitive and -Resistant Human Melanoma Cells with HUVEC Cells: A Label-Free Cell-Based Impedance Study.Biomedicines. 2023 May 26;11(6):1544. doi: 10.3390/biomedicines11061544. Biomedicines. 2023. PMID: 37371639 Free PMC article.
-
Advancing Organ-on-a-Chip Systems: The Role of Scaffold Materials and Coatings in Engineering Cell Microenvironment.Polymers (Basel). 2025 May 6;17(9):1263. doi: 10.3390/polym17091263. Polymers (Basel). 2025. PMID: 40363048 Free PMC article. Review.
-
The role of tumor-infiltrating lymphocytes in triple-negative breast cancer and the research progress of adoptive cell therapy.Front Immunol. 2023 May 18;14:1194020. doi: 10.3389/fimmu.2023.1194020. eCollection 2023. Front Immunol. 2023. PMID: 37275874 Free PMC article. Review.
-
Targeting JWA for Cancer Therapy: Functions, Mechanisms and Drug Discovery.Cancers (Basel). 2022 Sep 24;14(19):4655. doi: 10.3390/cancers14194655. Cancers (Basel). 2022. PMID: 36230577 Free PMC article. Review.
-
Anti-migratory Properties of Cryoprotective Isoliquiritigenin-zein Phosphatidylcholine Nanoparticles Prevent Triple-negative Breast Cancer through PI3K-mTOR and MMP2/9 Pathways.Curr Med Chem. 2025;32(9):1770-1788. doi: 10.2174/0109298673259973231023110945. Curr Med Chem. 2025. PMID: 37936460
References
MeSH terms
Substances
Grants and funding
- 2013/00798-2/São Paulo Research Foundation
- 2019/11437-7/São Paulo Research Foundation
- 001/Coordenação de Aperfeicoamento de Pessoal de Nível Superior
- 429235/2018-6/National Council for Scientific and Technological Development
- 306225/2017-4/National Council for Scientific and Technological Development
LinkOut - more resources
Full Text Sources
Medical
Miscellaneous
