

Profiling of the Bacterial Microbiota along the Murine Alimentary Tract
- PMID: 35163705
- PMCID: PMC8836272
- DOI: 10.3390/ijms23031783
Profiling of the Bacterial Microbiota along the Murine Alimentary Tract
Abstract
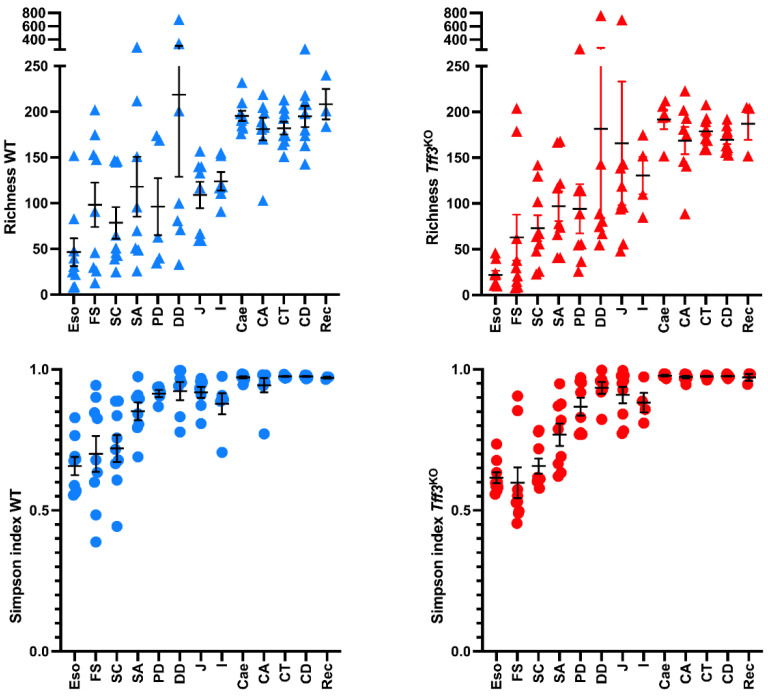
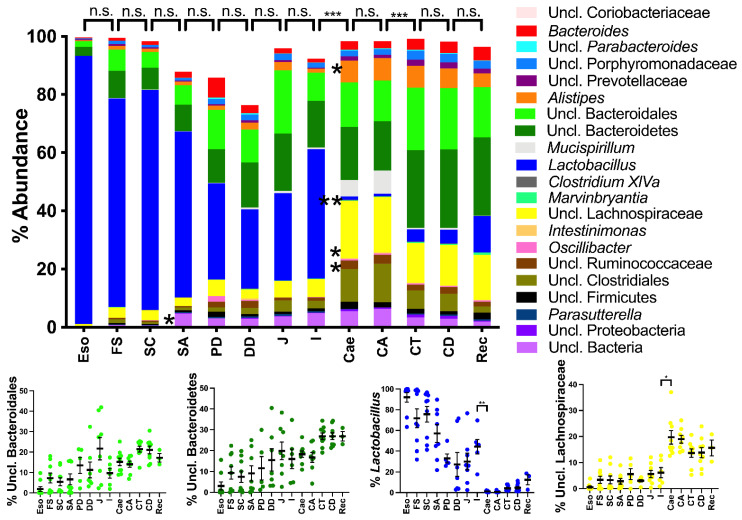
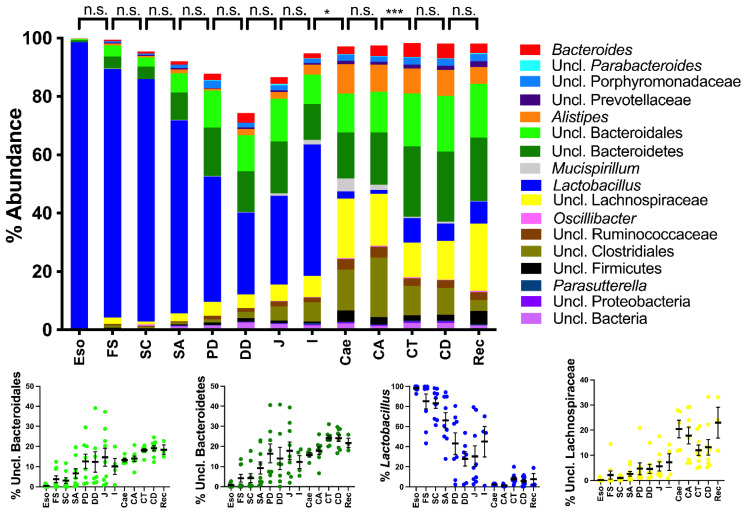
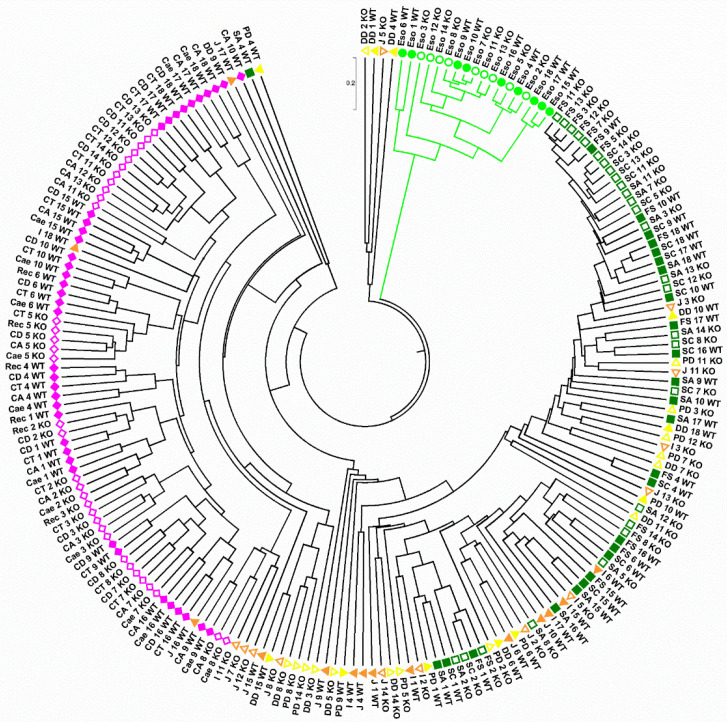
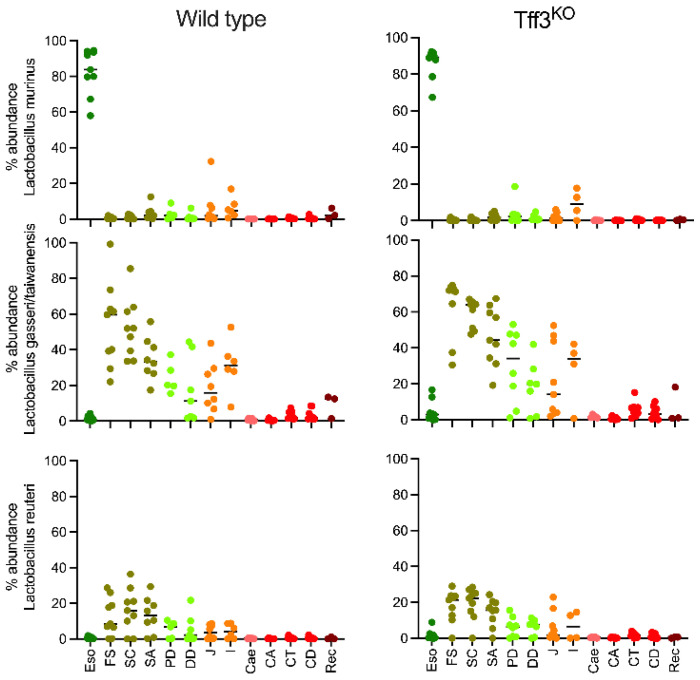
Here, the spatial distribution of the bacterial flora along the murine alimentary tract was evaluated using high throughput sequencing in wild-type and Tff3-deficient (Tff3KO) animals. Loss of Tff3 was linked to increased dextran sodium sulfate-induced colitis. This systematic study shows the results of 13 different regions from the esophagus to the rectum. The number of bacterial species (richness) increased from the esophagus to the rectum, from 50 to 200, respectively. Additionally, the bacterial community structure changed continuously; the highest changes were between the upper/middle and lower gastrointestinal compartments when comparing adjacent regions. Lactobacillus was the major colonizer in the upper/middle gastrointestinal tract, especially in the esophagus and stomach. From the caecum, a drastic diminution of Lactobacillus occurred, while members of Lachnospiraceae significantly increased. A significant change occurred in the bacterial community between the ascending and the transverse colon with Bacteroidetes being the major colonizers with relative constant abundance until the rectum. Interestingly, wild-type and Tff3KO animals did not show significant differences in their bacterial communities, suggesting that Tff3 is not involved in alterations of intraluminal or adhesive microbiota but is obviously important for mucosal protection, e.g., of the sensitive stem cells in the colonic crypts probably by a mucus plume.
Keywords: TFF3; colitis; esophagus; gut bacteria; gut microbiome; intestine; microbiota; mucus; stomach; trefoil factor.
Conflict of interest statement
The authors declare no conflict of interest. The funders had no role in the design of the study; in the collection, analyses, or interpretation of data; in the writing of the manuscript, or in the decision to publish the results.
Figures
Similar articles
-
Analysis of Transcriptionally Active Bacteria Throughout the Gastrointestinal Tract of Healthy Individuals.Gastroenterology. 2019 Oct;157(4):1081-1092.e3. doi: 10.1053/j.gastro.2019.05.068. Epub 2019 Jun 5. Gastroenterology. 2019. PMID: 31175864
-
Spatial heterogeneity of bacterial colonization across different gut segments following inter-species microbiota transplantation.Microbiome. 2020 Nov 18;8(1):161. doi: 10.1186/s40168-020-00917-7. Microbiome. 2020. PMID: 33208178 Free PMC article.
-
Qualitative and Quantitative DNA- and RNA-Based Analysis of the Bacterial Stomach Microbiota in Humans, Mice, and Gerbils.mSystems. 2018 Nov 20;3(6):e00262-18. doi: 10.1128/mSystems.00262-18. eCollection 2018 Nov-Dec. mSystems. 2018. PMID: 30505943 Free PMC article.
-
Systematic review: the effects of proton pump inhibitors on the microbiome of the digestive tract-evidence from next-generation sequencing studies.Aliment Pharmacol Ther. 2020 Mar;51(5):505-526. doi: 10.1111/apt.15604. Epub 2020 Jan 28. Aliment Pharmacol Ther. 2020. PMID: 31990420
-
Gut biogeography of the bacterial microbiota.Nat Rev Microbiol. 2016 Jan;14(1):20-32. doi: 10.1038/nrmicro3552. Epub 2015 Oct 26. Nat Rev Microbiol. 2016. PMID: 26499895 Free PMC article. Review.
Cited by
-
The Forms of the Lectin Tff2 Differ in the Murine Stomach and Pancreas: Indications for Different Molecular Functions.Int J Mol Sci. 2023 Apr 11;24(8):7059. doi: 10.3390/ijms24087059. Int J Mol Sci. 2023. PMID: 37108221 Free PMC article.
-
Prediction of anastomotic insufficiency based on the mucosal microbiome prior to colorectal surgery: a proof-of-principle study.Sci Rep. 2024 Jul 3;14(1):15335. doi: 10.1038/s41598-024-65320-w. Sci Rep. 2024. PMID: 38961176 Free PMC article.
-
Expression Profiling along the Murine Intestine: Different Mucosal Protection Systems and Alterations in Tff1-Deficient Animals.Int J Mol Sci. 2023 Aug 11;24(16):12684. doi: 10.3390/ijms241612684. Int J Mol Sci. 2023. PMID: 37628863 Free PMC article.
-
Biogeographical distribution of gut microbiome composition and function is partially recapitulated by fecal transplantation into germ-free mice.ISME J. 2025 Jan 2;19(1):wrae250. doi: 10.1093/ismejo/wrae250. ISME J. 2025. PMID: 39680691
-
The influence of antibiotic and mechanical bowel preparation on the microbiome in colorectal cancer surgery: A pilot study.Surg Pract Sci. 2025 Aug 6;22:100302. doi: 10.1016/j.sipas.2025.100302. eCollection 2025 Sep. Surg Pract Sci. 2025. PMID: 40838261 Free PMC article.
References
MeSH terms
Grants and funding
LinkOut - more resources
Full Text Sources
Molecular Biology Databases
Research Materials
