. 2022 Feb 4;23(3):1790.
doi: 10.3390/ijms23031790.

Lipid Droplet Accumulation Promotes RPE Dysfunction

Affiliations

Lipid Droplet Accumulation Promotes RPE Dysfunction

Tomohiro Yako et al. Int J Mol Sci. .

Abstract

Non-exudative age-related macular degeneration (AMD) is an irreversibly progressive retinal degenerative disease characterized by dysfunction and loss of retinal pigment epithelium (RPE). It has been suggested that impaired phagocytosis of the RPE is involved in the progression of non-exudative AMD, but the mechanism is not fully clear. In this study, we investigated the effect of lipid droplet accumulation on RPE function. Compared to young mice, the expression of lipid droplet-associated proteins increased in the RPE-choroidal complex, and lipid droplet in the RPE was observed in aged pigmented mice (12-month-old). Repeated treatment of the photoreceptor outer segment against ARPE-19 resulted in lipid droplets in ARPE-19 cells in vitro. Oleic acid treatment for ARPE-19 cells to form intracellular lipid droplet reduced the POS uptake into the ARPE-19 cells without causing a decrease in cell viability. The suppression of the POS uptake by lipid droplet formation improved by inhibiting lipid droplet formation using triacsin C. Moreover, the amount of intracellular reactive oxygen species was suppressed by the triacsin C treatment. These results indicate that lipid droplet is involved in the RPE dysfunction, and inhibiting lipid droplet formation may be a target for preventing and treating non-exudative AMD.

Keywords: aging; lipid droplet; phagocytosis; retinal pigment epithelium.


Conflict of interest statement

The authors declare no conflict of interest.

Figures

Figure 1
Figure 1
Changes in lipid droplet in the eye with age. (A,B) Expression levels of lipid droplet membrane proteins for young and aged mice in neural retina (A) and RPE-choroid complex (B). Data are the means ± standard error of means (SEMs) (n = 4 or 5 mice/group). ## p < 0.01, # p < 0.05 vs. young (Student’s t-test or Welch’s t-test). N.S.—No significant difference. (C) The representative transmission electron microscope (TEM) image of the RPE cell (n = 3 mice/group). Arrow head shows lipid droplet. Scale bar shows 1 µm.
Figure 2
Figure 2
Lipid droplet accumulation via POS phagocytosis. (A) Experimental protocol of POS treatment induced lipid droplet accumulation. Green arrow head shows lipid droplet staining timepoint, and orange arrow head shows POS treatment timepoint. (B) The representative image of lipid droplet (green) and Hoechst 33,342 (blue) following continuous (5- and 7-times) POS treatment. Scale bar shows 50 µm. (C) The quantitative data of the fluorescence intensity of lipid droplet. Data are the means ± SEMs (n = 4 independent experiments). ## p < 0.01 vs. without POS group (Dunnett’s test).
Figure 3
Figure 3
Decreased phagocytosis associated with lipid droplet accumulation. (A) Experimental protocol. Green arrow heads show lipid droplet staining timepoint (6, 12 and 24 h after oleic acid treatment). (B) The representative image of lipid droplet (green) and Hoechst 33,342 (blue) following 100 and 200 µM oleic acid treatment for 6–24 h. Scale bar shows 50 µm. (C) The quantitative data of fluorescence intensity of lipid droplet. Data are the means ± SEMs (n = 4 or 5 independent experiments). ## p < 0.01, # p < 0.05 vs. vehicle (Dunnett’s test). (D) Experimental protocol of phagocytosis assay after oleic acid treatment. Red arrow heads show the imaging timepoint (6, 12 and 24 h after pHrodo-POS treatment). (E) The representative image of phagocyted pHrodo-POS in ARPE-19 cells after 50 to 200 µM oleic acid treatment. Scale bar shows 100 µm. (F) The quantitative data of the pHrodo fluorescence intensity. Data are the means ± SEMs (n = 6 independent experiments). ## p < 0.01 vs. vehicle (Dunnett’s test).
Figure 4
Figure 4
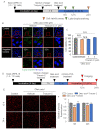
Improvement in phagocytosis by inhibition of lipid droplet accumulation. (A) Experimental protocol. Green arrow heads show lipid droplet staining timepoint (6 and 12 h after oleic acid treatment), and orange arrow head shows cell viability assay timepoint (24 h after oleic acid treatment). (B) The representative image of lipid droplet (green) and Hoechst 33342 (blue) following triacsin C and oleic acid treatment. Scale bar shows 10 µm (magnified image) or 50 µm. (C) The quantitative data of cell viability after triacsin C and oleic acid treatment. (D) Experimental protocol of phagocytosis assay after triacsin C and oleic acid treatment. Red arrow heads show the imaging timepoint (12 and 24 h after pHrodo-POS treatment). (E) The representative image of phagocyted pHrodo-POS in ARPE-19 cells after triacsin C and oleic acid treatment. Scale bar shows 100 µm. (F) The quantitative data of the pHrodo fluorescence intensity. Data are the means ± SEMs (n = 6 independent experiments). ## p < 0.01 vs. control, ** p < 0.01, * p < 0.05 vs. Oleic acid + vehicle (Tukey’s test). N.S.—No significant difference.
Figure 5
Figure 5
Suppression of ROS production by inhibition of lipid droplet accumulation. (A) Experimental protocol. Magenda arrow head shows CellROX staining timepoint. (B) The representative image of CellROX (magenta) and Hoechst 33342 (blue) after oleic acid and triacsin C treatment. Scale bar shows 50 µm. (C) The quantitative data of the CellROX intensity. Data are the means ± SEMs (n = 4 independent experiments). # p < 0.05 vs. vehicle (Welch’s t-test).

Similar articles

Cited by

References

    1. Kim J.-Y., Zhao H., Martinez J., Doggett T.A., Kolesnikov A.V., Tang P.H., Ablonczy Z., Chan C.-C., Zhou Z., Green D.R., et al. Noncanonical Autophagy Promotes the Visual Cycle. Cell. 2013;154:365–376. doi: 10.1016/j.cell.2013.06.012. - DOI - PMC - PubMed
    1. Apte R.S. Targeting Tissue Lipids in Age-Related Macular Degeneration. eBioMedicine. 2016;5:26–27. doi: 10.1016/j.ebiom.2016.02.003. - DOI - PMC - PubMed
    1. Yao J., Jia L., Khan N., Lin C., Mitter S.K., Boulton M.E., Dunaief J.L., Klionsky D.J., Guan J.-L., Thompson D.A., et al. Deletion of Autophagy Inducer RB1CC1 Results in Degeneration of the Retinal Pigment Epithelium. Autophagy. 2015;11:939–953. doi: 10.1080/15548627.2015.1041699. - DOI - PMC - PubMed
    1. Mitter S.K., Song C., Qi X., Mao H., Rao H., Akin D., Lewin A., Grant M., Dunn W., Ding J., et al. Dysregulated Autophagy in the RPE Is Associated with Increased Susceptibility to Oxidative Stress and AMD. Autophagy. 2014;10:1989–2005. doi: 10.4161/auto.36184. - DOI - PMC - PubMed
    1. Golestaneh N., Chu Y., Xiao Y.-Y., Stoleru G.L., Theos A.C. Dysfunctional Autophagy in RPE, a Contributing Factor in Age-Related Macular Degeneration. Cell Death Dis. 2018;8:e2537. doi: 10.1038/cddis.2016.453. - DOI - PMC - PubMed

Substances

LinkOut - more resources