. 2022 Feb 4;23(3):1796.
doi: 10.3390/ijms23031796.

Single-Cell Analysis Uncovers Osteoblast Factor Growth Differentiation Factor 10 as Mediator of Vascular Smooth Muscle Cell Phenotypic Modulation Associated with Plaque Rupture in Human Carotid Artery Disease

Affiliations

Single-Cell Analysis Uncovers Osteoblast Factor Growth Differentiation Factor 10 as Mediator of Vascular Smooth Muscle Cell Phenotypic Modulation Associated with Plaque Rupture in Human Carotid Artery Disease

Karim J Brandt et al. Int J Mol Sci. .

Abstract

(1) Background: Vascular smooth muscle cells (VSMCs) undergo a complex phenotypic switch in response to atherosclerosis environmental triggers, contributing to atherosclerosis disease progression. However, the complex heterogeneity of VSMCs and how VSMC dedifferentiation affects human carotid artery disease (CAD) risk has not been clearly established. (2) Method: A single-cell RNA sequencing analysis of CD45- cells derived from the atherosclerotic aorta of Apolipoprotein E-deficient (Apoe-/-) mice on a normal cholesterol diet (NCD) or a high cholesterol diet (HCD), respecting the site-specific predisposition to atherosclerosis was performed. Growth Differentiation Factor 10 (GDF10) role in VSMCs phenotypic switch was investigated via flow cytometry, immunofluorescence in human atherosclerotic plaques. (3) Results: scRNAseq analysis revealed the transcriptomic profile of seven clusters, five of which showed disease-relevant gene signature of VSMC macrophagic calcific phenotype, VSMC mesenchymal chondrogenic phenotype, VSMC inflammatory and fibro-phenotype and VSMC inflammatory phenotype. Osteoblast factor GDF10 involved in ossification and osteoblast differentiation emerged as a hallmark of VSMCs undergoing phenotypic switch. Under hypercholesteremia, GDF10 triggered VSMC osteogenic switch in vitro. The abundance of GDF10 expressing osteogenic-like VSMCs cells was linked to the occurrence of carotid artery disease (CAD) events. (4) Conclusions: Taken together, these results provide evidence about GDF10-mediated VSMC osteogenic switch, with a likely detrimental role in atherosclerotic plaque stability.

Keywords: atherosclerosis; carotid artery disease; vascular smooth muscle cells.


Conflict of interest statement

The authors declare no conflict of interest.

Figures
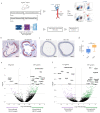
Figure 1
Figure 1
(a) Experimental setting of scRNAseq of CD45 cells. (b) Oil Red O stained atherosclerotic lesions of Apoe−/−. (c) Oil Red O stained DT aorta of Apoe−/−. (d) Bar graphs represent the mean ± SEM of atherosclerotic lesion quantification with n = 6–8/group and ***p < 0.001. (e) Volcano plot showing relative gene expression of CD45 cells derived from AA&R of Apoe−/− on NCD versus HCD. Each dot represents a gene within the performed comparison (p-Adj < 0.05, Log2 > ±0.58), n = 6 mice/group. (f) Volcano plot showing significance versus relative gene expression of CD45 negative cells derived from DT aorta of Apoe−/− on NCD versus HCD. Each dot represents a gene within the performed comparison (p-Adj < 0.05, Log2 > ±0.58), n = 6 mice/group.
Figure 2
Figure 2
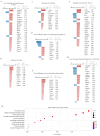
HCD-induced signaling in AA&R (a) Gene Ontology Cellular Response To Stress; (b) Response to Lipid; (c) Response to Cytokine; (d) Focal Adhesion-PI3K-Akt-mTOR-signaling Pathway; (e) Gene Onthology Actin Cytoskeleton Organization; (f) Regulation of Apoptotic Process; (g) Gene Onthology Negative Regulation of Cell Death; (h) Bubble plot of selected GO terms enriched in AA&R of Apoe−/− on NCD versus HCD. Dot size is proportional to the number of genes overlapping 222with each GO term, and the adjusted p-value is color-coded from red to blue.
Figure 3
Figure 3
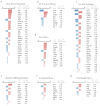
(a) Muscle Structure Development; (b) ESC Pluripotency Pathways; (c) Vasculature Development; (d) Focal Adhesion; (e) Regulation of BMP Signaling Pathway; (f) IL-6 Signaling Pathway; (g) TGF-β Signaling Pathway; (h) Bubble plot of selected GO terms enriched in DT aorta of Apoe−/− on NCD versus HCD. Dot size is proportional to the number of genes overlapping with each GO term, and the adjusted p-value is color-coded from red to blue.
Figure 3
Figure 3
(a) Muscle Structure Development; (b) ESC Pluripotency Pathways; (c) Vasculature Development; (d) Focal Adhesion; (e) Regulation of BMP Signaling Pathway; (f) IL-6 Signaling Pathway; (g) TGF-β Signaling Pathway; (h) Bubble plot of selected GO terms enriched in DT aorta of Apoe−/− on NCD versus HCD. Dot size is proportional to the number of genes overlapping with each GO term, and the adjusted p-value is color-coded from red to blue.
Figure 4
Figure 4
Clusters of AA&R and DT aorta cells t-distributed stochastic neighbor embedding (tSNE) plot showing: (a) all seven identified clusters; (b) AA&R and DT aorta clusters of Apoe−/− mice on NCD or HCD; (c) Relative frequency of cells derived from AA&R and DT aorta of Apoe−/− mice on NCD and HCD composing the 7 clusters.
Figure 5
Figure 5
Clusters Gene Expression Signature. (a) Heatmap illustrating the top differentially expressed genes among all detected clusters. (b) Top 5 differentially expressed genes detected in each cluster.
Figure 6
Figure 6
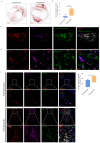
Vascular calcification and GDF10 expression in osteogenic-like VSMCs in mouse atherosclerotic plaques. Vascular calcification in aortic roots (a) as shown by representative images of Alizarin red staining of Apoe−/− mice on NCD and HCD, scale bars: 200 μm and (b) representative images of Alkaline Phosphatase staining of Apoe−/− mice on NCD and HCD, scale bars: 200 μm. (c) Bar graphs represent the mean ± SEM of the percentage of Alizarin red positively stained areas in the total atherosclerotic plaque area of aortic roots, n = 6–8 mice and **p < 0.01. (d) GDF10 expression among the seven clusters, n = 6 mice/group. (e) Bar graphs represent the mean ± SEM of GDF10+ Alkaline Phosphatase+ cells expressed as percentage of the total Myh11eYFP+ plaque cells, n = 6–8 mice and *p < 0.05. (f) Bar graphs represent the mean ± SEM of Myh11eYFP+ GDF10 + RUNX2+ cells expressed as percentage of the total plaque cells, n = 6–8 mice and **p < 0.01. (g) Representative immunofluorescence staining of GDF10 (purple) and Alkaline Phosphatase cells (red) and Myh11eYFP (green) expressing aortic root cells in Apoe−/−Myh11-CreERT2, ROSA26STOP-floxeYFP+/+ mice fed NCD or HCD. (h) Representative immunofluorescence staining of GDF10 (purple) and RUNX2 (red) and Myh11eYFP (green) expressing aortic root cells of Apoe−/−Myh11-CreERT2, ROSA26STOP-floxeYFP+/+ mice fed NCD or HCD.
Figure 6
Figure 6
Vascular calcification and GDF10 expression in osteogenic-like VSMCs in mouse atherosclerotic plaques. Vascular calcification in aortic roots (a) as shown by representative images of Alizarin red staining of Apoe−/− mice on NCD and HCD, scale bars: 200 μm and (b) representative images of Alkaline Phosphatase staining of Apoe−/− mice on NCD and HCD, scale bars: 200 μm. (c) Bar graphs represent the mean ± SEM of the percentage of Alizarin red positively stained areas in the total atherosclerotic plaque area of aortic roots, n = 6–8 mice and **p < 0.01. (d) GDF10 expression among the seven clusters, n = 6 mice/group. (e) Bar graphs represent the mean ± SEM of GDF10+ Alkaline Phosphatase+ cells expressed as percentage of the total Myh11eYFP+ plaque cells, n = 6–8 mice and *p < 0.05. (f) Bar graphs represent the mean ± SEM of Myh11eYFP+ GDF10 + RUNX2+ cells expressed as percentage of the total plaque cells, n = 6–8 mice and **p < 0.01. (g) Representative immunofluorescence staining of GDF10 (purple) and Alkaline Phosphatase cells (red) and Myh11eYFP (green) expressing aortic root cells in Apoe−/−Myh11-CreERT2, ROSA26STOP-floxeYFP+/+ mice fed NCD or HCD. (h) Representative immunofluorescence staining of GDF10 (purple) and RUNX2 (red) and Myh11eYFP (green) expressing aortic root cells of Apoe−/−Myh11-CreERT2, ROSA26STOP-floxeYFP+/+ mice fed NCD or HCD.
Figure 7
Figure 7
GDF10 expression in osteogenic-like VSMCs in human atherosclerotic Plaques. Vascular calcification as shown in the (a) representative images of Alizarin red staining of human atherosclerotic Plaques of asymptomatic and symptomatic CAD patients, respectively, scale bars: 800 μm. (b) Bar graphs represent quantification of vascular calcification of human atherosclerotic plaques expressed as the mean ± SEM of Alizarin red positively stained areas in the total atherosclerotic plaque area of asymptomatic and symptomatic CAD patients, respectively, n = 8 and **p < 0.01. (c) Representative immunofluorescence staining showing Myh11, GDF10 and Alkaline Phosphatase positive cells in area of vascular calcification in human atherosclerotic lesions of carotid artery tissue of CAD patient; Myh11 (red), GDF10 (purple) and Alkaline Phosphatase staining (green). (d) Representative immunofluorescence staining of Myh11 (red), GDF10 (purple) and OsteoSense (green) in area of vascular microcalcification in human atherosclerotic lesions of asymptomatic and symptomatic CAD patients. (e) Representative immunofluorescence staining of Myh11 (red), GDF10 (purple) and RUNX2 (green) expressing cells in human atherosclerotic lesions of asymptomatic and symptomatic CAD patients and bar graphs represent the mean ± SEM of Myh11+GDF10+RUNX2+ cells of asymptomatic and symptomatic CAD patients, respectively, n = 8 and *p < 0.01.
Figure 8
Figure 8
GDF10-associated VSMC phenotypic transition to osteogenic-like cells. (a) Representative flow cytometry histogram showing GDF10 staining in VSMC and bar graph representing the mean ± SEM of GDF10 expression in WT VSMC and Apoe−/−VSMC cells, n = 6 and **p < 0.01. (b) Representative dot plots and bar graph representing the mean ± SEM of GDF10+RUNX2+ WT VSMC and Apoe−/−VSMC cells, n = 6 and **p < 0.01. (c) GDF10+Osteopontin+ WT VSMC and Apoe−/−VSMC cells, n = 6 and **p < 0.01. (d) GDF10+Alkaline Phosphatese+ WT VSMC and Apoe−/−VSMC cells, n = 6 and *p < 0.05. (e) GDF10+CD68+ WT VSMC and Apoe−/−VSMC, n = 6 and **p < 0.01. (f) GDF10+ RUNX2+ VSMC, VSMC oxLDL and VSMC oxLDL GDF10 cells quantified by flow cytometry, n = 6 and *p < 0.01. (g) GDF10+Osteopontin+ VSMC, VSMC oxLDL and VSMC oxLDL GDF10 cells, n = 6, **p < 0.01 and ***p < 0.001. (h) GDF-10+Osteopotin+ VSMC, VSMC oxLDL and VSMC oxLDL GDF-10 cells, n = 6 and ***p < 0.01. (i) GDF10+Osteopontin+ positive VSMC, VSMC oxLDL and VSMC oxLDL GDF-10 cells, bar graph represents the mean ± SEM of GDF10+Osteopontin+ VSMC, VSMC oxLDL and VSMC oxLDL GDF10 cells quantified by flow cytometry, n = 6, *p < 0.05, **p < 0.01 and ***p < 0.001.

Similar articles

Cited by

References

    1. Mozaffarian D., Benjamin E.J., Go A.S., Arnett D.K., Blaha M.J., Cushman M., Das S.R., de Ferranti S., Despres J.P., Fullerton H.J., et al. Heart Disease and Stroke Statistics—2016 Update: A Report From the American Heart Association. Circulation. 2016;133:e38–e360. doi: 10.1161/CIR.0000000000000350. - DOI - PubMed
    1. Xiao F., Wang C., Wang C., Gao Y., Zhang X., Chen X. BMPER Enhances Bone Formation by Promoting the Osteogenesis-Angiogenesis Coupling Process in Mesenchymal Stem Cells. Cell Physiol. Biochem. 2018;45:1927–1939. doi: 10.1159/000487969. - DOI - PubMed
    1. Bennett M.R., Sinha S., Owens G.K. Vascular Smooth Muscle Cells in Atherosclerosis. Circ. Res. 2016;118:692–702. doi: 10.1161/CIRCRESAHA.115.306361. - DOI - PMC - PubMed
    1. Virmani R., Burke A.P., Kolodgie F.D., Farb A. Vulnerable plaque: The pathology of unstable coronary lesions. J. Interv. Cardiol. 2002;15:439–446. doi: 10.1111/j.1540-8183.2002.tb01087.x. - DOI - PubMed
    1. Pfaltzgraff E.R., Shelton E.L., Galindo C.L., Nelms B.L., Hooper C.W., Poole S.D., Labosky P.A., Bader D.M., Reese J. Embryonic domains of the aorta derived from diverse origins exhibit distinct properties that converge into a common phenotype in the adult. J. Mol. Cell Cardiol. 2014;69:88–96. doi: 10.1016/j.yjmcc.2014.01.016. - DOI - PMC - PubMed

Substances