. 2022 Feb 5;23(3):1812.
doi: 10.3390/ijms23031812.

Interaction of Alpha Synuclein and Microtubule Organization Is Linked to Impaired Neuritic Integrity in Parkinson's Patient-Derived Neuronal Cells

Affiliations

Interaction of Alpha Synuclein and Microtubule Organization Is Linked to Impaired Neuritic Integrity in Parkinson's Patient-Derived Neuronal Cells

Lukas Seebauer et al. Int J Mol Sci. .

Abstract

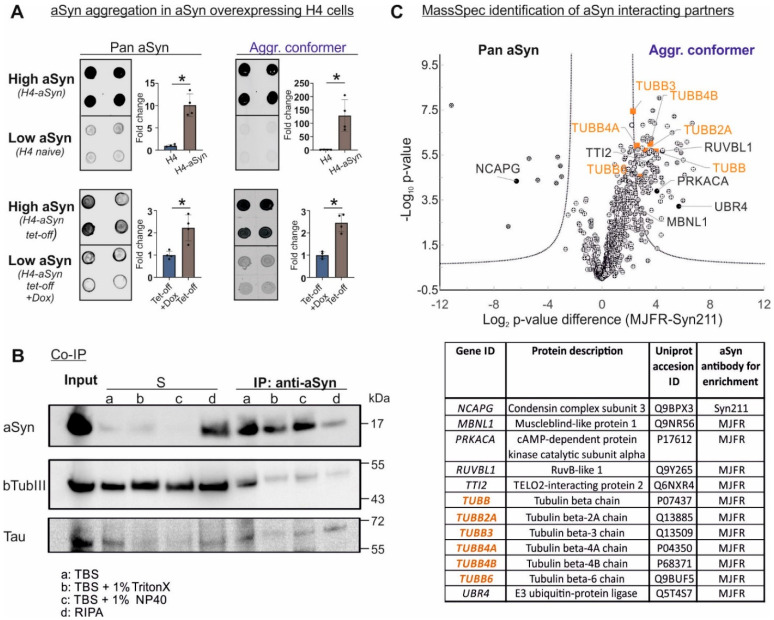
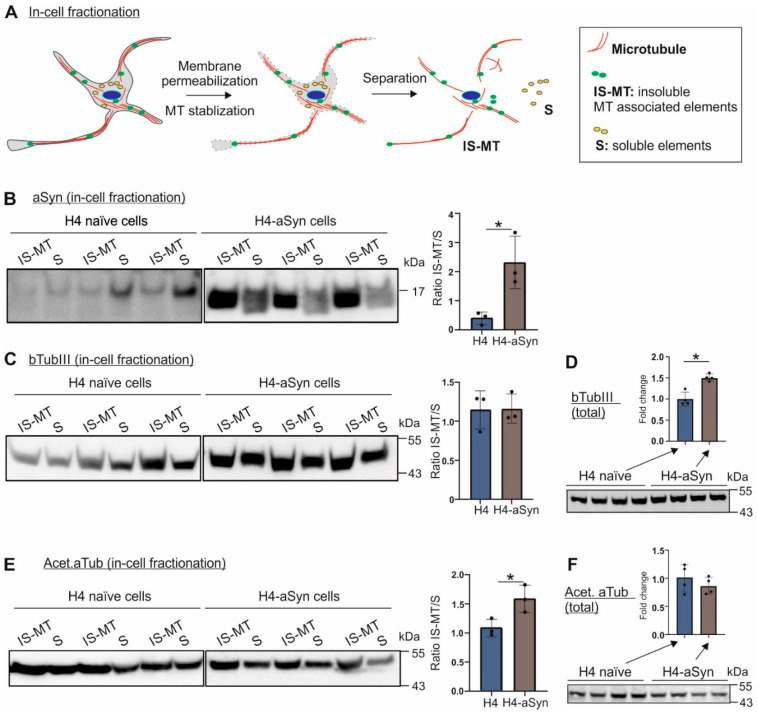
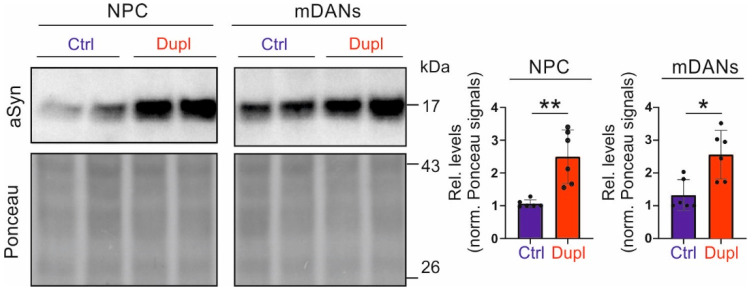
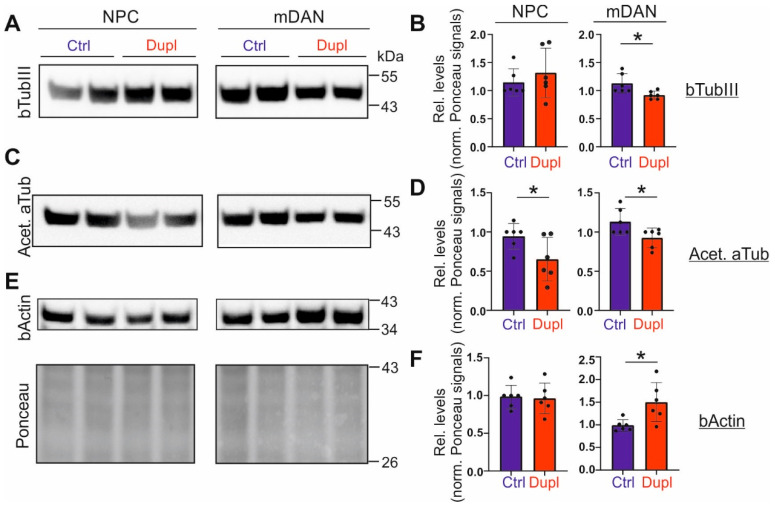
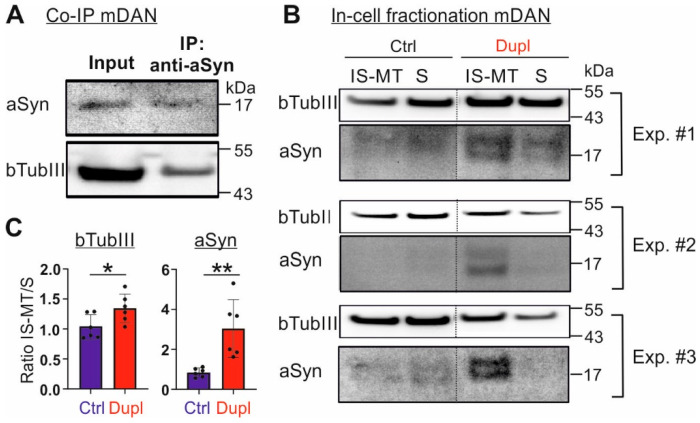
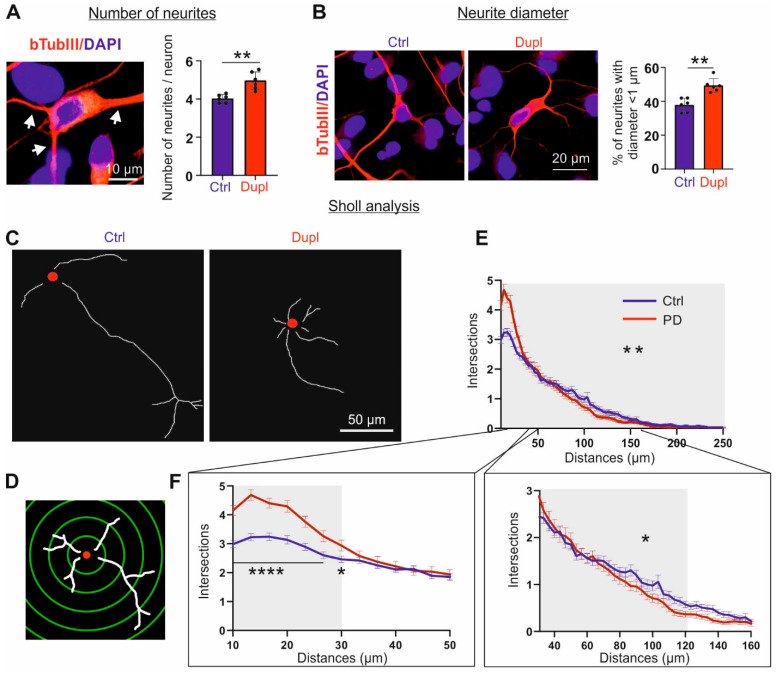
Parkinson's disease (PD) is neuropathologically characterized by the loss of dopaminergic neurons and the deposition of aggregated alpha synuclein (aSyn). Mounting evidence suggests that neuritic degeneration precedes neuronal loss in PD. A possible underlying mechanism could be the interference of aSyn with microtubule organization in the neuritic development, as implied by several studies using cell-free model systems. In this study, we investigate the impact of aSyn on microtubule organization in aSyn overexpressing H4 neuroglioma cells and midbrain dopaminergic neuronal cells (mDANs) generated from PD patient-derived human induced pluripotent stem cells (hiPSCs) carrying an aSyn gene duplication (SNCADupl). An unbiased mass spectrometric analysis reveals a preferential binding of aggregated aSyn conformers to a number of microtubule elements. We confirm the interaction of aSyn with beta tubulin III in H4 and hiPSC-derived mDAN cell model systems, and demonstrate a remarkable redistribution of tubulin isoforms from the soluble to insoluble fraction, accompanied by a significantly increased insoluble aSyn level. Concordantly, SNCADupl mDANs show impaired neuritic phenotypes characterized by perturbations in neurite initiation and outgrowth. In summary, our findings suggest a mechanistic pathway, through which aSyn aggregation interferes with microtubule organization and induces neurite impairments.

Keywords: Parkinson’s disease; SNCA duplication; alpha-synuclein; iPSC; microtubule; neurite; neurodegeneration.


Conflict of interest statement

The authors declare no conflict of interest.

Figures

Figure 1
Figure 1
Interaction of aSyn and tubulin in aSyn overexpressing H4 cells. (A) Dot blot analysis of total aSyn and aggregated aSyn in aSyn overexpressing H4 cell models (high aSyn: H4-aSyn and H4-aSyn tet-off cells) and their respective low aSyn expressing cell lines (low aSyn, naïve H4 cells and H4-aSyn tet-off+Dox). Total aSyn levels were determined by using a pan aSyn antibody Syn 1, while the levels of aggregated aSyn conformers (aggr. conformer) were assessed by using a conformation-specific antibody MJFR-14-6-4-2. Both aSyn overexpressing cell lines (high aSyn) exhibit higher levels of aSyn aggregates when comparted to their respective low aSyn counterparts. Total protein loaded was controlled by direct blue staining (shown in Supplementary Figure S1). For quantification, the fold change in aSyn level in a high aSyn cell line was calculated by normalization against total protein (direct blue) and the average level in the corresponding low aSyn cells (n = 4). Statistics: Mann–Whitney test; * p < 0.05. (B) Immunoprecipitation of aSyn from H4-aSyn cells using a pan aSyn antibody Syn1. bTubIII and Tau are co-precipitated. For immunoprecipitation, a buffer without detergents (TBS, a), buffers containing non-ionic milder detergents (TBS + 1% Triton X 100, b or TBS + 1% NP40, c), or a buffer containing stronger detergents (RIPA, d) were used. bTubIII and Tau are detectable in all conditions. (C) Mass spectrometric identification of proteins co-precipitated with aSyn in H4-aSyn tet-off cells. Co-immunoprecipitation was performed by using the pan aSyn antibody Syn211 or the conformation-specific anti-aSyn antibody MJFR-14-6-4-2. Volcano plots of co-precipitated proteins identified by mass spectrometry are shown (left: proteins co-precipitated with Syn211, right: proteins co-precipitated with MJFR-14-6-4-2). Significant proteins from two independent experiments are over the solid lines. Identified microtubule-associated proteins are highlighted by their gene ID and listed in the table. A two-tailed t-test was performed in Perseus (1.6.10.43) using a permutation-based FDR to account for the multiple testing hypothesis (technical injection replicates were preserved during randomization). Candidates were filtered using an FDR of 1% and a fold change (s0) of 2.
Figure 2
Figure 2
Impact of aSyn overexpression on microtubule organization. (A) Scheme of in-cell fractionation approach for separation of soluble (S) and insoluble, microtubule-associated fraction (IS-MT). (B,C,E) WB images (left) and quantification (right) of aSyn (B), bTubIII (C), and acetylated aTub (Acet. aTub, E) in S and IS-MT fractions extracted from H4 naïve and H4-aSyn cells. For quantification, the ratio of aSyn, bTubIII or acetylated aTub in the IS-MT versus the S fraction was calculated and values from three experiments were used (n = 3). aSyn overexpression in H4 cells leads to a shift of aSyn and acetylated aTub into IS-MT pools. Statistics: unpaired t-test; * p < 0.05. (D,F) WB analysis of total bTubIII (D) and acetylated aTub levels (F) in H4 naïve and H4-aSyn cells. Fold changes were calculated by normalization against Ponceau intensity (shown in Supplementary Figure S2) and the average level of H4 naïve cells (n = 4). The values are shown as mean ± SD. Statistics: Mann–Whitney test; * p < 0.05.
Figure 3
Figure 3
aSyn levels in SNCADupl patient-derived cells. Representative WB images (left) and the quantification (right) of aSyn levels in NPCs as well as in mDANs differentiated for 10 days, which were generated from healthy controls (Ctrl) and the duplication patient (Dupl), respectively. aSyn levels are significantly higher in SNCADupl NPCs and mDANs compared to control cells. Relative levels were calculated by normalization against Ponceau intensity and the level of a control line in each differentiation round. The values are shown as mean ± SD. Values from two control lines as well as two SNCADupl lines and three independent differentiation rounds per line were used for the quantification (n = 3/line). Statistics: Mann–Whitney test; * p < 0.05, ** p < 0.01.
Figure 4
Figure 4
Expression levels of cytoskeletal proteins in SNCADupl patient-derived cells. Representative WB images and the quantification of bTubIII (A,B), acetylated aTub (acet. aTub) (C,D) and bActin (E,F) levels in NPCs as well as mDANs after differentiation for 10 days, generated from healthy controls (Ctrl) and the SNCADupl patient (Dupl), respectively. bTubIII and acetylated aTub levels are significantly reduced in mDANs carrying SNCADupl as compared to control mDANs from healthy individuals, while bActin levels are significantly increased in SNCADupl mDANs. Relative levels were calculated by normalization against Ponceau intensity and the level of a control line in each differentiation round. The protein loading control with Ponceau staining for bTubIII is shown in this figure. Ponceau staining for acetylated aTub and bActin is provided in Supplementary Figure S4A. The values are shown as mean ± SD. Values from two control lines as well as two SNCADupl lines and three independent differentiation rounds per cell line were used for the quantification (n = 3/line). Statistics: Mann–Whitney test; * p < 0.05.
Figure 5
Figure 5
Interaction of aSyn and bTubIII and their reorganization in SNCADupl mDANs. (A) WB analysis of immunoprecipitation of aSyn from hiPSC-derived mDANs differentiated for 10 days by using an anti-aSyn antibody (Syn1). bTubIII is co-precipitated with aSyn. (B) In-cell fractionation of control and SNCADupl mDANs and WB analysis of aSyn and bTubIII in soluble (S) and insoluble, microtubule-associated (IS-MT) fractions. Representative WB images of three experiments (#1, #2, #3) with mDANs from one control and one SNCADupl hiPSC cell line are shown. Note, due to a strong dilution effect after immunoprecipitation and in-cell fractionation, transferred aSyn on the blots shown in (A,B) was only visible by loading the maximum volume onto SDS-PAGE gels and using the SuperSignal™ West Femto Maximum Sensitivity Substrate kit (Thermo Fisher Scientific). (C) For quantification, the ratio of bTubIII or aSyn in the IS-MT versus the S fraction was calculated. Values from one control line as well as one SNCADupl line and three independent differentiation rounds per cell line were used for the quantification (n = 3/line). aSyn overexpression in hiPSC-neurons leads to a shift of aSyn and bTubIII into the IS-MT pool. Statistics: unpaired t-test; * p < 0.05; ** p < 0.01.
Figure 6
Figure 6
Analysis of neurite morphology of neurons differentiated from hiPSCs. (A) An example neuron (left) for the analysis of primary neurite numbers per cell (right). Neurite numbers of bTubIII positive neurons were counted using the “Cell counter” plugin within ImageJ software. The SNCADupl neurons show more primary neurites per cell than the control neurons. Total n > 800 neurons in twelve images per condition were examined. (B) Representative images of bTubIII+ neurons (red) derived from the control and SNCADupl hiPSC. Neurite diameter was examined by measuring the diameter of each neurite, where it leaves the cell body using “Straight Line” tool within ImageJ. Quantification shows an increase in thin neurites with a diameter <1 µm in SNCADupl neurons compared to control neurons. Microscope images with at least 800 neurites per condition were examined. For the quantification shown in A and B, average values from two control lines as well as two SNCADupl lines and three independent differentiation rounds per line were used and are shown in mean ± SD (n = 3/line). Statistics: Mann–Whitney test; ** p < 0.01. (C–F) Sholl analysis of control and SNCADupl neurons. (C) Representative micrographs of skeletonized neurons from a control and SNCADupl neuron, respectively. The nuclei are highlighted by red solid circles and resemble the center for Sholl analysis on a single cell level. (D) Scheme of Sholl analysis of a skeletonized neuron with neurites (white) and superimposed centric circles (green). The radius interval between circles was 3.3 µm per step, ranging from 10 to 250 µm from the center of the neuronal nuclei (red). (E) The numbers of neurite intersections show a significantly stronger decrease in SNCADupl neurites compared to the control neurons. For quantification, the number of intersections per neuron was counted. Mean ± SEM from n = 120 control and SNCADupl neurons, respectively, are shown. For statistics, the decrease in intersections per cell was determined by the slope decrease in intersections per cell ranging from 10–250 µm (grey) and the average slope difference between control and PD neurons (120 neurons, respectively) were evaluated using unpaired t-test (** p < 0.01). (F) Left: In the near proximity of the soma (distance range 10 to 30 µm, grey), the number of neurite intersections in SNCADupl neurons is significantly higher than in the control neurons, indicating an increase in short neurites in SNCADupl neurons. Statistics: two-way ANOVA; * p < 0.05, **** p < 0.0001. Right: at the long distance range from the soma (30 to 120 µm, grey), the number of neurite intersections in SNCADupl neurons is lower as compared to control neurons, indicating a decrease in long neurites in SNCADupl neurons. For statistics, the decrease in intersections per cell was determined by the slope decrease in intersections per cell ranging from 30 to 120 µm and the average slope difference between control and PD neurons (120 neurons) was evaluated by unpaired t-test (* p < 0.05).

Similar articles

Cited by

References

    1. Goedert M., Spillantini M.G., Del Tredici K., Braak H. 100 Years of Lewy Pathology. Nat. Rev. Neurol. 2013;9:13–24. doi: 10.1038/nrneurol.2012.242. - DOI - PubMed
    1. Shahmoradian S.H., Lewis A.J., Genoud C., Hench J., Moors T.E., Navarro P.P., Castano-Diez D., Schweighauser G., Graff-Meyer A., Goldie K.N., et al. Lewy Pathology in Parkinson’s Disease Consists of Crowded Organelles and Lipid Membranes. Nat. Neurosci. 2019;22:1099–1109. doi: 10.1038/s41593-019-0423-2. - DOI - PubMed
    1. Spillantini M.G., Schmidt M.L., Lee V.M., Trojanowski J.Q., Jakes R., Goedert M. Alpha-Synuclein in Lewy Bodies. Nature. 1997;388:839–840. doi: 10.1038/42166. - DOI - PubMed
    1. Maroteaux L., Campanelli J.T., Scheller R.H. Synuclein: A Neuron-Specific Protein Localized to the Nucleus and Presynaptic Nerve Terminal. J. Neurosci. 1988;8:2804–2815. doi: 10.1523/JNEUROSCI.08-08-02804.1988. - DOI - PMC - PubMed
    1. Klein C., Schlossmacher M.G. The Genetics of Parkinson‘s Disease: Implications for Neurological Care. Nat. Clin. Pract. Neurol. 2006;2:136–146. doi: 10.1038/ncpneuro0126. - DOI - PubMed

MeSH terms