Review
. 2022 Feb 5;23(3):1826.
doi: 10.3390/ijms23031826.

The Physiology of Insulin Clearance

Affiliations
Review

The Physiology of Insulin Clearance

Richard N Bergman et al. Int J Mol Sci. .

Abstract

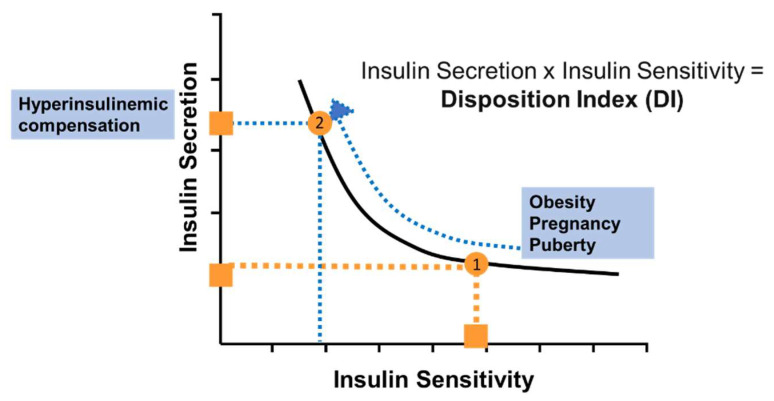
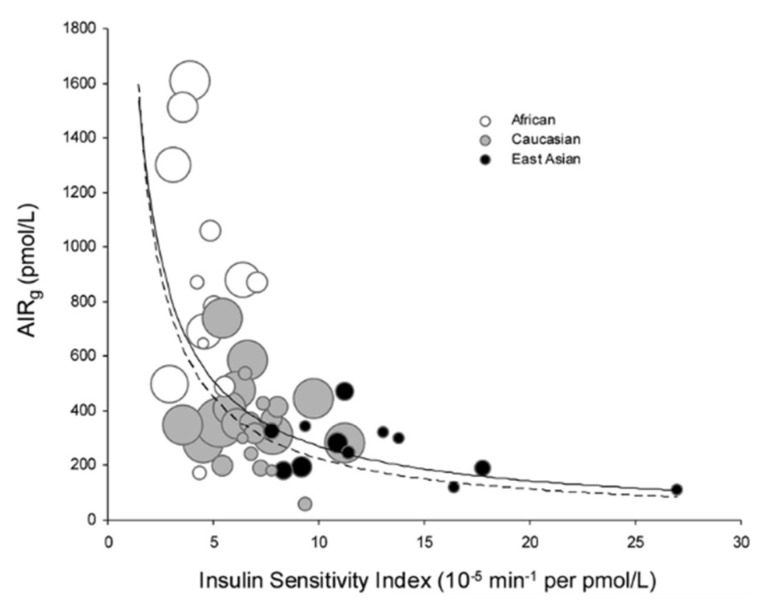
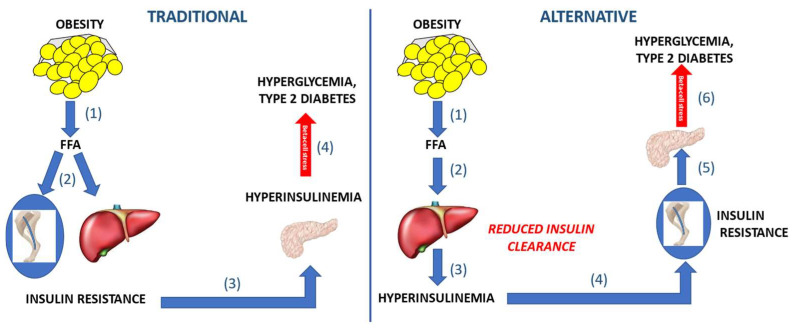
In the 1950's, Dr. I. Arthur Mirsky first recognized the possible importance of insulin degradation changes to the pathogenesis of type 2 diabetes. While this mechanism was ignored for decades, insulin degradation is now being recognized as a possible factor in diabetes risk. After Mirsky, the relative importance of defects in insulin release and insulin resistance were recognized as risk factors. The hyperbolic relationship between secretion and sensitivity was introduced, as was the relationship between them, as expressed as the disposition index (DI). The DI was shown to be affected by environmental and genetic factors, and it was shown to be differentiated among ethnic groups. However, the importance of differences in insulin degradation (clearance) on the disposition index relationship remains to be clarified. Direct measure of insulin clearance revealed it to be highly variable among even normal individuals, and to be affected by fat feeding and other physiologic factors. Insulin clearance is relatively lower in ethnic groups at high risk for diabetes such as African Americans and Hispanic Americans, compared to European Americans. These differences exist even for young children. Two possible mechanisms have been proposed for the importance of insulin clearance for diabetes risk: in one concept, insulin resistance per se leads to reduced clearance and diabetes risk. In a second and new concept, reduced degradation is a primary factor leading to diabetes risk, such that lower clearance (resulting from genetics or environment) leads to systemic hyperinsulinemia, insulin resistance, and beta-cell stress. Recent data by Chang and colleagues appear to support this latter hypothesis in Native Americans. The importance of insulin clearance as a risk factor for metabolic disease is becoming recognized and may be treatable.

Keywords: beta-cell failure; disposition index; insulin clearance; type 2 diabetes.


Conflict of interest statement

The authors declare no conflict of interest relevant to this article.

Figures

Figure 1
Figure 1
Insulin release (Plasma IRI: immunoreactive insulin) in response to the intravenous administration of glucose in normal and diabetic subjects. Mean fasting plasma glucose concentrations: normal subjects = 85 ± 3 mg/dL; noninsulin-dependent diabetic subjects (NIDDs) = 180 ± 10 mg/dL; and insulin-dependent diabetic subjects (IDDs) = 325 ± 33 mg/dL. Note the lack of first-phase insulin response and the preservation of second-phase insulin response in noninsulin-dependent diabetic subjects, and the total lack of any response to glucose in the insulin-dependent diabetic subjects. Pfeifer MA et al. AM J Med 70:579, 1981.
Figure 2
Figure 2
The “Law of Glucose Tolerance”. It is proposed that there is a hyperbolic relationship between insulin sensitivity and insulin release. Lower insulin sensitivity (insulin resistance) is associated with a greater insulin secretion, such that the product of sensitivity and secretion is a factor termed the “Disposition Index”. A lowering of insulin sensitivity (by increased adiposity, infection, pregnancy for example) would result in move of the orange dot (1) to the left (dotted orange line). However, it is proposed that associated with the reduction in insulin sensitivity would be an increase in beta-cell response. Thus, the trajectory would be represented as a simultaneous increase in insulin response, so the trajectory would be represented by a move along the blue curve to a point on the hyperbola, but on the upper left (2).
Figure 3
Figure 3
First publication of the hyperbolic relationship between beta-cell response (abscissa) and insulin sensitivity (ordinate). Subjects were segregated into those with poor glucose tolerance and good glucose tolerance. From Ref. [30].
Figure 4
Figure 4
Meta-analysis by Kodama and colleagues of a large number of assessments of insulin sensitivity (abscissa) and insulin release (ordinate) in multiple cohorts of African, East Asian and Caucasian populations. Note that the best-fit hyperbola is a reasonable overall description of all participants. From Ref. [12].
Figure 5
Figure 5
Euglycemic clamp experiments in which insulin was infused stepwise either systemically or into the portal vein of the liver. Infusion rates were chosen to attain approximately matched systemic insulin levels (see text; (A)). A plot of systemic insulin levels as a function of insulin infusion (B) yielded a lower slope with portal infusion due to first-pass liver insulin clearance. The ratio of the slopes in Figure 5B yielded a direct and accurate measure of first-pass hepatic clearance of insulin. From Ref. [33].
Figure 6
Figure 6
Two possible concepts of the pathogenesis of type 2 diabetes. Traditional concept (left panel): (1) Obesity causes increased flux of free fatty acids (FFA) flux which (2) results in insulin resistance at skeletal muscle and liver, (3) stimulating the beta-cells to release compensating insulin. (4) Elevated insulin compounds insulin resistance; when beta-cell compensation is inadequate, type 2 diabetes may ensue. Alternative concept (right panel): (1) Increased adiposity leads to release of FFA into circulation. (2) FFA are envisioned to reduce the clearance of insulin by the liver as a primary event in the pathogenesis. (3) Thus, lower degradation causes elevated insulin levels in blood. (4) Hyperinsulinemia exacerbates insulin resistance in skeletal muscle. (5) Insulin resistance necessitates a greater insulin secretory response in compensation; (6) ultimately beta-cell stress synergizes insulin resistance, causing type 2 diabetes.

Similar articles

Cited by

References

    1. National Institutes of Health Clinical Guidelines on the Identification, Evaluation; Treatment of Overweight and Obesity in Adults—The Evidence Report. Obes. Res. 1998;6((Suppl. S2)):51s–209s. - PubMed
    1. Mirsky I.A. Insulinase. Diabetes. 1957;6:448–449. doi: 10.2337/diab.6.5.448. - DOI - PubMed
    1. Mirsky I.A., Broh-Kahn R.H. The inactivation of insulin by tissue extracts; the distribution and properties of insulin inactivating extracts. Arch. Biochem. 1949;20:1–9. - PubMed
    1. Mirsky I.A., Perisutti G., Diengott D. Effect of insulinase-inhibitor on destruction of insulin by intact mouse. Proc. Soc. Exp. Biol. Med. 1955;88:76–78. doi: 10.3181/00379727-88-21497. - DOI - PubMed
    1. Simkin B., Broh-Kahn R.H., Mirsky I.A. The inactivation of insulin by tissue extracts; the effect of force-fed diets on the insulinase activity of rat liver extracts. Arch. Biochem. 1949;24:422–428. - PubMed