Phosphorylation of Eukaryotic Initiation Factor 4G1 (eIF4G1) at Ser1147 Is Specific for eIF4G1 Bound to eIF4E in Delayed Neuronal Death after Ischemia
- PMID: 35163752
- PMCID: PMC8836865
- DOI: 10.3390/ijms23031830
Phosphorylation of Eukaryotic Initiation Factor 4G1 (eIF4G1) at Ser1147 Is Specific for eIF4G1 Bound to eIF4E in Delayed Neuronal Death after Ischemia
Abstract
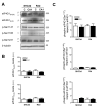
Ischemic strokes are caused by a reduction in cerebral blood flow and both the ischemic period and subsequent reperfusion induce brain injury, with different tissue damage depending on the severity of the ischemic insult, its duration, and the particular areas of the brain affected. In those areas vulnerable to cerebral ischemia, the inhibition of protein translation is an essential process of the cellular response leading to delayed neuronal death. In particular, translation initiation is rate-limiting for protein synthesis and the eukaryotic initiation factor (eIF) 4F complex is indispensable for cap-dependent protein translation. In the eIF4F complex, eIF4G is a scaffolding protein that provides docking sites for the assembly of eIF4A and eIF4E, binding to the cap structure of the mRNA and stabilizing all proteins of the complex. The eIF4F complex constituents, eIF4A, eIF4E, and eIF4G, participate in translation regulation by their phosphorylation at specific sites under cellular stress conditions, modulating the activity of the cap-binding complex and protein translation. This work investigates the phosphorylation of eIF4G1 involved in the eIF4E/eIF4G1 association complex, and their regulation in ischemia-reperfusion (IR) as a stress-inducing condition. IR was induced in an animal model of transient cerebral ischemia and the results were studied in the resistant cortical region and in the vulnerable hippocampal CA1 region. The presented data demonstrate the phosphorylation of eIF4G1 at Ser1147, Ser1185, and Ser1231 in both brain regions and in control and ischemic conditions, being the phosphorylation of eIF4G1 at Ser1147 the only one found in the eIF4E/eIF4G association complex from the cap-containing matrix (m7GTP-Sepharose). In addition, our work reveals the specific modulation of the phosphorylation of eIF4G1 at Ser1147 in the vulnerable region, with increased levels and colocalization with eIF4E in response to IR. These findings contribute to elucidate the molecular mechanism of protein translation regulation that underlies in the balance of cell survival/death during pathophysiological stress, such as cerebral ischemia.
Keywords: cerebral ischemia; confocal microscopy; eIF4E; eIF4G1; neuronal death; protein phosphorylation; protein synthesis regulation; vulnerable regions.
Conflict of interest statement
The authors declare no conflict of interest. The funders had no role in the design of the study; in the collection, analyses, or interpretation of data; in the writing of the manuscript, or in the decision to publish the results.
Figures


Similar articles
-
Stress Granule Induction after Brain Ischemia Is Independent of Eukaryotic Translation Initiation Factor (eIF) 2α Phosphorylation and Is Correlated with a Decrease in eIF4B and eIF4E Proteins.J Biol Chem. 2016 Dec 30;291(53):27252-27264. doi: 10.1074/jbc.M116.738989. Epub 2016 Nov 11. J Biol Chem. 2016. PMID: 27836976 Free PMC article.
-
Dynamic Interaction of Eukaryotic Initiation Factor 4G1 (eIF4G1) with eIF4E and eIF1 Underlies Scanning-Dependent and -Independent Translation.Mol Cell Biol. 2018 Aug 28;38(18):e00139-18. doi: 10.1128/MCB.00139-18. Print 2018 Sep 15. Mol Cell Biol. 2018. PMID: 29987188 Free PMC article.
-
The translational repressor eIF4E-binding protein 2 (4E-BP2) correlates with selective delayed neuronal death after ischemia.J Cereb Blood Flow Metab. 2013 Aug;33(8):1173-81. doi: 10.1038/jcbfm.2013.60. Epub 2013 Apr 17. J Cereb Blood Flow Metab. 2013. PMID: 23591646 Free PMC article.
-
Manipulation of the host translation initiation complex eIF4F by DNA viruses.Biochem Soc Trans. 2010 Dec;38(6):1511-6. doi: 10.1042/BST0381511. Biochem Soc Trans. 2010. PMID: 21118117 Review.
-
The Proteins Diversity of the eIF4E Family in the eIF4F Complex.Biochemistry (Mosc). 2025 Jan;90(Suppl 1):S60-S85. doi: 10.1134/S0006297924603721. Biochemistry (Mosc). 2025. PMID: 40164153 Review.
Cited by
-
Calpain as a Therapeutic Target for Hypoxic-Ischemic Encephalopathy.Mol Neurobiol. 2024 Jan;61(1):533-540. doi: 10.1007/s12035-023-03594-3. Epub 2023 Aug 29. Mol Neurobiol. 2024. PMID: 37642934 Review.
-
PPP6R3-mediated dephosphorylation regulates mRNA translation during spermatogonial differentiation.Commun Biol. 2025 Jul 28;8(1):1114. doi: 10.1038/s42003-025-08539-1. Commun Biol. 2025. PMID: 40721635 Free PMC article.
-
SPIDR enables multiplexed mapping of RNA-protein interactions and uncovers a mechanism for selective translational suppression upon cell stress.Cell. 2025 Jul 22:S0092-8674(25)00743-3. doi: 10.1016/j.cell.2025.06.042. Online ahead of print. Cell. 2025. PMID: 40701149 Free PMC article.
References
-
- Feigin V.L., Forouzanfar M.H., Krishnamurthi R., Mensah G.A., Connor M., Bennett D.A., Moran A.E., Sacco R.L., Anderson L., Truelsen T., et al. Global and regional burden of stroke during 1990–2010: Findings from the Global Burden of Disease Study 2010. Lancet. 2014;383:245–254. doi: 10.1016/S0140-6736(13)61953-4. - DOI - PMC - PubMed
-
- Mozaffarian D., Benjamin E.J., Go A.S., Arnett D.K., Blaha M.J., Cushman M., Das S.R., de Ferranti S., Despres J.P., Fullerton H.J., et al. Heart Disease and Stroke Statistics-2016 Update: A Report From the American Heart Association. Circulation. 2016;133:e38–360. doi: 10.1161/CIR.0000000000000350. - DOI - PubMed
MeSH terms
Substances
Grants and funding
LinkOut - more resources
Full Text Sources
Molecular Biology Databases
Miscellaneous

