

Autophagy-Related Gene PlATG6a Is Involved in Mycelial Growth, Asexual Reproduction and Tolerance to Salt and Oxidative Stresses in Peronophythora litchii
- PMID: 35163762
- PMCID: PMC8836449
- DOI: 10.3390/ijms23031839
Autophagy-Related Gene PlATG6a Is Involved in Mycelial Growth, Asexual Reproduction and Tolerance to Salt and Oxidative Stresses in Peronophythora litchii
Abstract
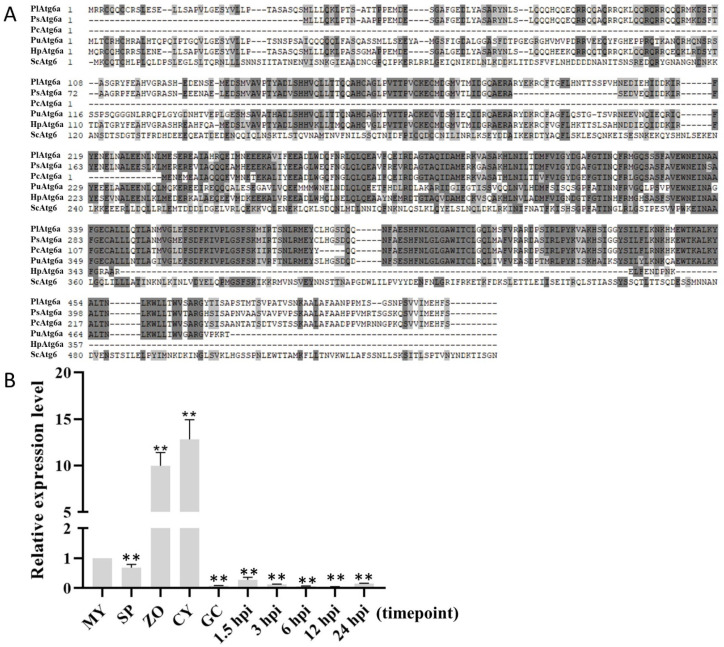
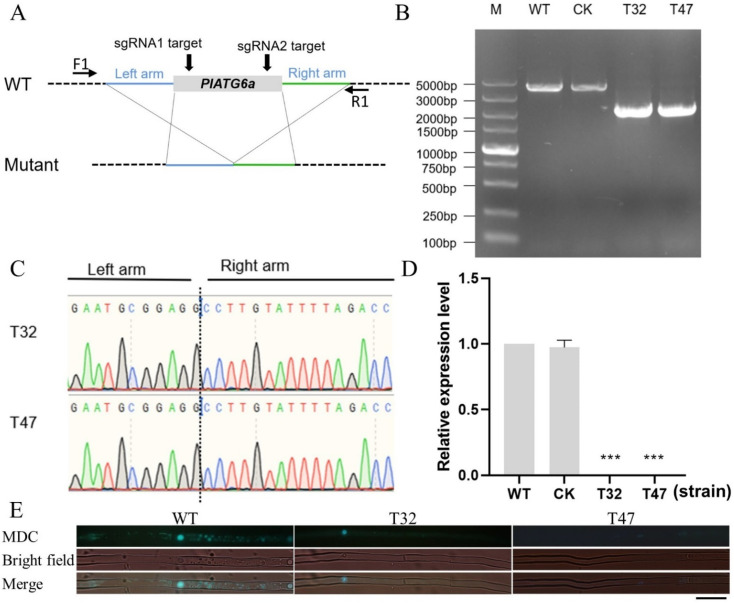
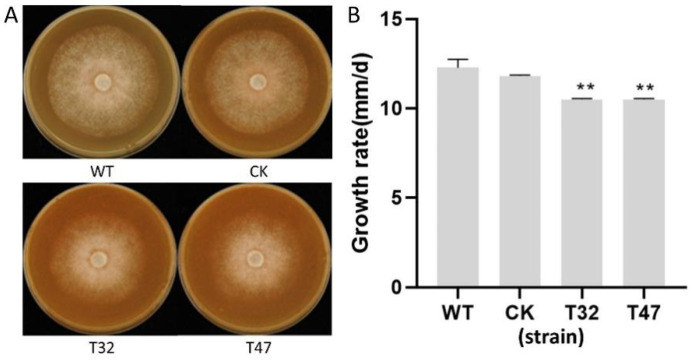
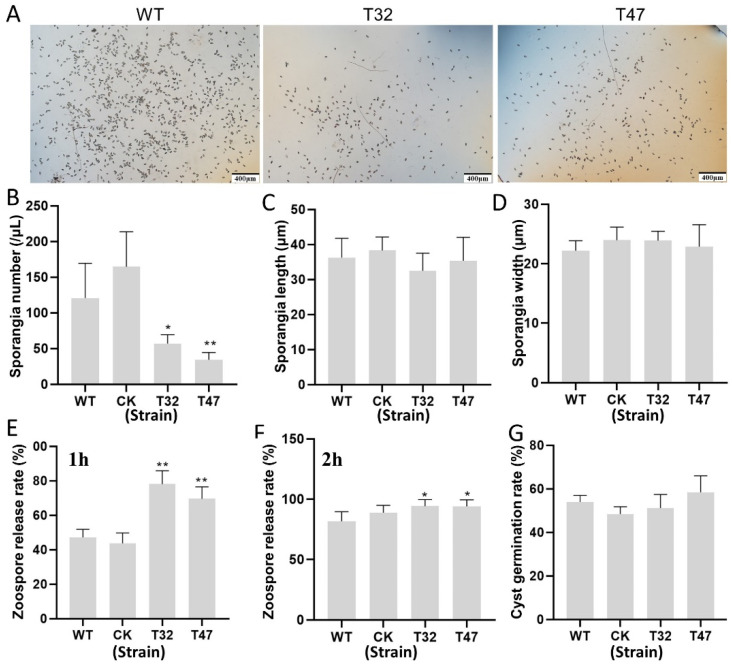
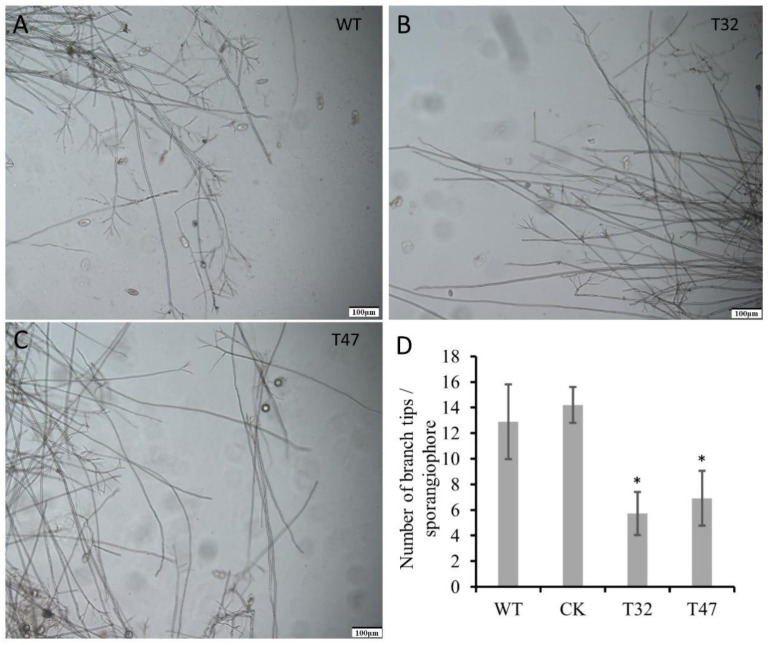
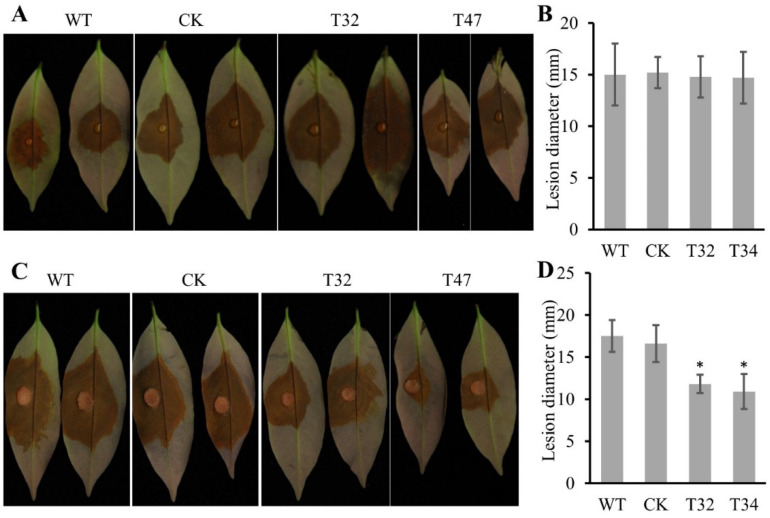
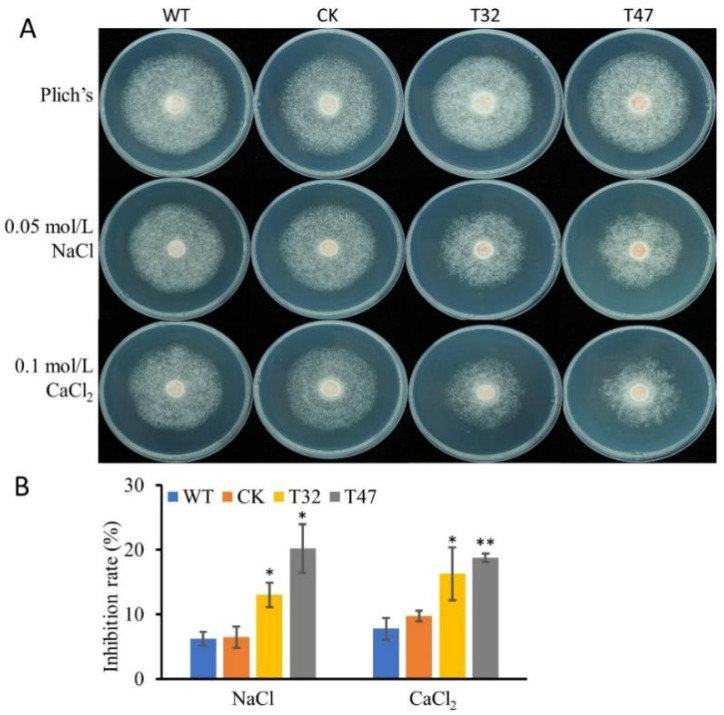
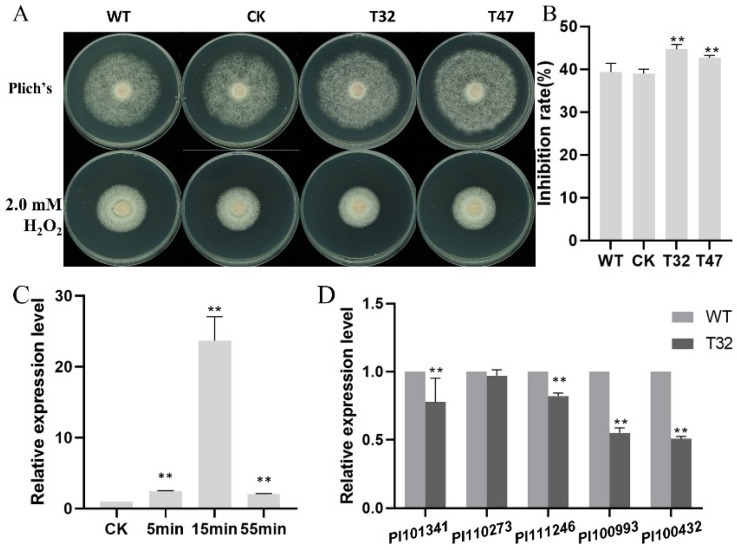
Autophagy is ubiquitously present in eukaryotes. During this process, intracellular proteins and some waste organelles are transported into lysosomes or vacuoles for degradation, which can be reused by the cell to guarantee normal cellular metabolism. However, the function of autophagy-related (ATG) proteins in oomycetes is rarely known. In this study, we identified an autophagy-related gene, PlATG6a, encoding a 514-amino-acid protein in Peronophythora litchii, which is the most destructive pathogen of litchi. The transcriptional level of PlATG6a was relatively higher in mycelium, sporangia, zoospores and cysts. We generated PlATG6a knockout mutants using CRISPR/Cas9 technology. The P. litchii Δplatg6a mutants were significantly impaired in autophagy and vegetative growth. We further found that the Δplatg6a mutants displayed decreased branches of sporangiophore, leading to impaired sporangium production. PlATG6a is also involved in resistance to oxidative and salt stresses, but not in sexual reproduction. The transcription of peroxidase-encoding genes was down-regulated in Δplatg6a mutants, which is likely responsible for hypersensitivity to oxidative stress. Compared with the wild-type strain, the Δplatg6a mutants showed reduced virulence when inoculated on the litchi leaves using mycelia plugs. Overall, these results suggest a critical role for PlATG6a in autophagy, vegetative growth, sporangium production, sporangiophore development, zoospore release, pathogenesis and tolerance to salt and oxidative stresses in P. litchii.
Keywords: ATG6; Peronophythora litchii; autophagy-related gene; mycelial growth; oxidative stress; pathogenicity; sporangium production.
Conflict of interest statement
The authors declare no conflict of interest.
Figures
Similar articles
-
PlAtg8-mediated autophagy regulates vegetative growth, sporangial cleavage, and pathogenesis in Peronophythora litchii.Microbiol Spectr. 2024 Jan 11;12(1):e0353123. doi: 10.1128/spectrum.03531-23. Epub 2023 Dec 12. Microbiol Spectr. 2024. PMID: 38084976 Free PMC article.
-
Signal and regulatory mechanisms involved in spore development of Phytophthora and Peronophythora.Front Microbiol. 2022 Sep 9;13:984672. doi: 10.3389/fmicb.2022.984672. eCollection 2022. Front Microbiol. 2022. PMID: 36160220 Free PMC article. Review.
-
The Basic Leucine Zipper Transcription Factor PlBZP32 Associated with the Oxidative Stress Response Is Critical for Pathogenicity of the Lychee Downy Blight Oomycete Peronophythora litchii.mSphere. 2020 Jun 3;5(3):e00261-20. doi: 10.1128/mSphere.00261-20. mSphere. 2020. PMID: 32493721 Free PMC article.
-
A Puf RNA-binding protein encoding gene PlM90 regulates the sexual and asexual life stages of the litchi downy blight pathogen Peronophythora litchii.Fungal Genet Biol. 2017 Jan;98:39-45. doi: 10.1016/j.fgb.2016.12.002. Epub 2016 Dec 7. Fungal Genet Biol. 2017. PMID: 27939344
-
The oomycete broad-host-range pathogen Phytophthora capsici.Mol Plant Pathol. 2012 May;13(4):329-37. doi: 10.1111/j.1364-3703.2011.00754.x. Epub 2011 Oct 20. Mol Plant Pathol. 2012. PMID: 22013895 Free PMC article. Review.
Cited by
-
PlAtg8-mediated autophagy regulates vegetative growth, sporangial cleavage, and pathogenesis in Peronophythora litchii.Microbiol Spectr. 2024 Jan 11;12(1):e0353123. doi: 10.1128/spectrum.03531-23. Epub 2023 Dec 12. Microbiol Spectr. 2024. PMID: 38084976 Free PMC article.
-
Role of autophagy in plant growth and adaptation to salt stress.Planta. 2025 Jan 31;261(3):49. doi: 10.1007/s00425-025-04615-2. Planta. 2025. PMID: 39885016 Review.
-
Signal and regulatory mechanisms involved in spore development of Phytophthora and Peronophythora.Front Microbiol. 2022 Sep 9;13:984672. doi: 10.3389/fmicb.2022.984672. eCollection 2022. Front Microbiol. 2022. PMID: 36160220 Free PMC article. Review.
-
Autophagy-related protein PlATG2 regulates the vegetative growth, sporangial cleavage, autophagosome formation, and pathogenicity of peronophythora litchii.Virulence. 2024 Dec;15(1):2322183. doi: 10.1080/21505594.2024.2322183. Epub 2024 Mar 4. Virulence. 2024. PMID: 38438325 Free PMC article.
-
A Novel FYVE Domain-Containing Protein Kinase, PsZFPK1, Plays a Critical Role in Vegetative Growth, Sporangium Formation, Oospore Production, and Virulence in Phytophthora sojae.J Fungi (Basel). 2023 Jun 28;9(7):709. doi: 10.3390/jof9070709. J Fungi (Basel). 2023. PMID: 37504698 Free PMC article.
References
-
- Chen X.R., Wang X.L., Zhang Z.G., Wang Y.C., Zheng X.B. Differences in the induction of the oxidative burst in compatible and incompatible interactions of soybean and Phytophthora sojae. Physiol. Mol. Plant Pathol. 2008;73:16–24. doi: 10.1016/j.pmpp.2008.10.002. - DOI
MeSH terms
Substances
Grants and funding
LinkOut - more resources
Full Text Sources
