Central Nervous System Stimulants Limit Caffeine Transport at the Blood-Cerebrospinal Fluid Barrier
- PMID: 35163784
- PMCID: PMC8836437
- DOI: 10.3390/ijms23031862
Central Nervous System Stimulants Limit Caffeine Transport at the Blood-Cerebrospinal Fluid Barrier
Abstract
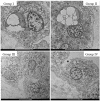
Caffeine, a common ingredient in energy drinks, crosses the blood-brain barrier easily, but the kinetics of caffeine across the blood-cerebrospinal fluid barrier (BCSFB) has not been investigated. Therefore, 127 autopsy cases (Group A, 30 patients, stimulant-detected group; and Group B, 97 patients, no stimulant detected group) were examined. In addition, a BCSFB model was constructed using human vascular endothelial cells and human choroid plexus epithelial cells separated by a filter, and the kinetics of caffeine in the BCSFB and the effects of 4-aminopyridine (4-AP), a neuroexcitatory agent, were studied. Caffeine concentrations in right heart blood (Rs) and cerebrospinal fluid (CSF) were compared in the autopsy cases: caffeine concentrations were higher in Rs than CSF in Group A compared to Group B. In the BCSFB model, caffeine and 4-AP were added to the upper layer, and the concentration in the lower layer of choroid plexus epithelial cells was measured. The CSF caffeine concentration was suppressed, depending on the 4-AP concentration. Histomorphological examination suggested that choroid plexus epithelial cells were involved in inhibiting the efflux of caffeine to the CSF. Thus, the simultaneous presence of stimulants and caffeine inhibits caffeine transfer across the BCSFB.
Keywords: BCSFB model; GC/MS; blood–cerebrospinal fluid barrier (BCSFB); caffeine; choroid plexus; stimulants; vacuolation.
Conflict of interest statement
The authors declare no conflict of interest.
Figures


Similar articles
-
Role of cationic drug-sensitive transport systems at the blood-cerebrospinal fluid barrier in para-tyramine elimination from rat brain.Fluids Barriers CNS. 2018 Jan 8;15(1):1. doi: 10.1186/s12987-017-0087-9. Fluids Barriers CNS. 2018. PMID: 29307307 Free PMC article.
-
Modeling immune functions of the mouse blood-cerebrospinal fluid barrier in vitro: primary rather than immortalized mouse choroid plexus epithelial cells are suited to study immune cell migration across this brain barrier.Fluids Barriers CNS. 2016 Jan 29;13:2. doi: 10.1186/s12987-016-0027-0. Fluids Barriers CNS. 2016. PMID: 26833402 Free PMC article.
-
Characterization of thyroid hormone transport in a human choroid plexus papilloma cell line (HIBCPP) as an in vitro blood-cerebrospinal fluid barrier model.Mol Cell Endocrinol. 2025 Feb 1;597:112449. doi: 10.1016/j.mce.2024.112449. Epub 2024 Dec 29. Mol Cell Endocrinol. 2025. PMID: 39740754
-
A new in vitro model for blood-cerebrospinal fluid barrier transport studies: an immortalized choroid plexus epithelial cell line derived from the tsA58 SV40 large T-antigen gene transgenic rat.Adv Drug Deliv Rev. 2004 Oct 14;56(12):1875-85. doi: 10.1016/j.addr.2004.07.013. Adv Drug Deliv Rev. 2004. PMID: 15381338 Review.
-
Immune surveillance of the human central nervous system (CNS): different migration pathways of immune cells through the blood-brain barrier and blood-cerebrospinal fluid barrier in healthy persons.Cytometry A. 2006 Mar;69(3):147-51. doi: 10.1002/cyto.a.20225. Cytometry A. 2006. PMID: 16479603 Review.
Cited by
-
Evaluation of Drug Blood-Brain-Barrier Permeability Using a Microfluidic Chip.Pharmaceutics. 2024 Apr 23;16(5):574. doi: 10.3390/pharmaceutics16050574. Pharmaceutics. 2024. PMID: 38794236 Free PMC article.
-
Plant Alkaloids as Promising Anticancer Compounds with Blood-Brain Barrier Penetration in the Treatment of Glioblastoma: In Vitro and In Vivo Models.Molecules. 2025 Mar 31;30(7):1561. doi: 10.3390/molecules30071561. Molecules. 2025. PMID: 40286187 Free PMC article. Review.
References
-
- Fujihara J., Yasuda Y., Kimura-Takaoka K., Hasegawa M., Kurata S., Takashita H. Two fatal cases of caffeine poisoning and a review of the literature. Shimane J. Med. Sci. 2017;34:55–59.
MeSH terms
Substances
LinkOut - more resources
Full Text Sources
Medical
Miscellaneous

