. 2022 Feb 7;23(3):1867.
doi: 10.3390/ijms23031867.

Structural and Functional Differences between Homologous Bacterial Ribonucleases

Affiliations

Structural and Functional Differences between Homologous Bacterial Ribonucleases

Vera Ulyanova et al. Int J Mol Sci. .

Abstract

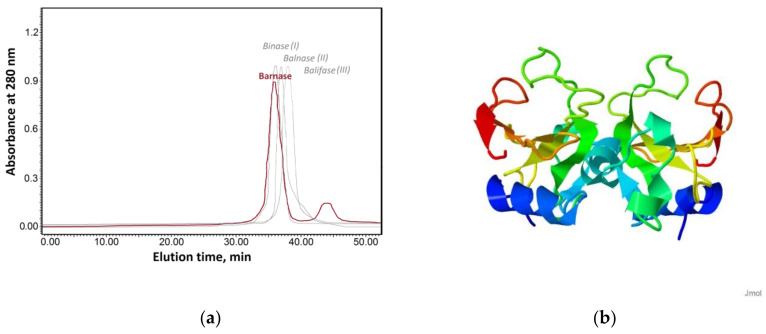
Small cationic guanyl-preferring ribonucleases (RNases) produced by the Bacillus species share a similar protein tertiary structure with a high degree of amino acid sequence conservation. However, they form dimers that differ in conformation and stability. Here, we have addressed the issues (1) whether the homologous RNases also have distinctions in catalytic activity towards different RNA substrates and interactions with the inhibitor protein barstar, and (2) whether these differences correlate with structural features of the proteins. Circular dichroism and dynamic light scattering assays revealed distinctions in the structures of homologous RNases. The activity levels of the RNases towards natural RNA substrates, as measured spectrometrically by acid-soluble hydrolysis products, were similar and decreased in the row high-polymeric RNA >>> transport RNA > double-stranded RNA. However, stopped flow kinetic studies on model RNA substrates containing the guanosine residue in a hairpin stem or a loop showed that the cleavage rates of these enzymes were different. Moreover, homologous RNases were inhibited by the barstar with diverse efficiency. Therefore, minor changes in structure elements of homologous proteins have a potential to significantly effect molecule stability and functional activities, such as catalysis or ligand binding.

Keywords: balifase; balnase; barnase; barstar; binase; catalytic activity; ribonuclease; ribonuclease inhibitor; structural organization.


Conflict of interest statement

The authors declare no conflict of interest. The funders had no role in the design of the study; in the collection, analyses, or interpretation of data; in the writing of the manuscript, or in the decision to publish the results.

Figures

Figure 1
Figure 1
Distribution of structured regions along the RNase chains. Secondary structures of binase, balifase and balnase were predicted based on their amino acid sequences by DeepCNF. The elements of secondary structure of binase in solution (1buj) were extracted from PDB data.
Figure 2
Figure 2
Circular dichroism (CD) spectral scans of binase (■), balnase (▼) and balifase (○).
Figure 3
Figure 3
The size of RNase molecules in solution.
Figure 4
Figure 4
The change in the FAM fluorescence intensity during the interaction of binase (Bi) and balifase (Blf) with the Gloop and Gds substrates. The enzyme and substrate concentrations were 0.5 µM.
Figure 5
Figure 5
Electrophoretic separation of reaction products upon cleavage of the Gds substrate by homologous RNases in the presence of barstar. (a) Reaction performed by binase, (b) Reaction performed by balifase. Lanes: (1) Gds + 5.3 мкM barstar; (2) Gds + Enzyme; (3) Gds + Enzyme + 0.3 мкM barstar; (4) Gds + Enzyme + 0.7 мкM barstar; (5) Gds + Enzyme + 1.3 мкM barstar; (6) Gds + Enzyme + 2.7 мкM barstar; (7) Gds + Enzyme + 5.3 мкM barstar. Substrate concentration was 1 µM, enzyme concentration was 0.7 µM. (c) Dependence of the degree of the Gds degradation by binase (Bi), balifase (Blf) and RNase A on the barstar concentration.
Figure 6
Figure 6
The structural organization of barnase. (a) Size exclusion chromatography of barnase in comparison to binase (I), balnase (II) and balifase (III). Major peaks correspond to dimer form of RNases, minor peak is represented by barnase monomer. Molecular weights of barnase peaks were calculated using equation obtained from elution profile of marker proteins. (b) Putative model of barnase dimer.
Figure 7
Figure 7
Models of barstar interaction with RNase dimers. (a) Barnase dimer; (b) balifase dimer; (c) binase dimer. Monomers of RNase dimers are colored in blue and red. Their active sites are faced upwards (except for the monomer of binase colored in blue). Two molecules of barstar are depicted in light and dark green. Active centers (AC) of RNases are marked by arrows.

Similar articles

Cited by

References

    1. Warner K.D., Hajdin C.E., Weeks K.M. Principles for targeting RNA with drug-like small molecules. Nat. Rev. Drug. Discov. 2018;17:547–558. doi: 10.1038/nrd.2018.93. - DOI - PMC - PubMed
    1. Yu A.M., Choi Y.H., Tu M. RNA drugs and RNA targets for small molecules: Principles, progress, and challenges. Pharmacol. Rev. 2020;4:862–898. doi: 10.1124/pr.120.019554. - DOI - PMC - PubMed
    1. Bechhofer D.H., Deutscher M.P. Bacterial ribonucleases and their roles in RNA metabolism. Crit. Rev. Biochem. Mol. Biol. 2019;54:242–300. doi: 10.1080/10409238.2019.1651816. - DOI - PMC - PubMed
    1. Takahashi K., Moore S. 13 Ribonuclease T1. Enzymes. 1982;15:435–467.
    1. Rosenberg H.F. RNase A ribonucleases and host defense: An evolving story. J. Leukoc. Biol. 2008;83:1079–1087. doi: 10.1189/jlb.1107725. - DOI - PMC - PubMed

LinkOut - more resources