. 2022 Feb 8;23(3):1913.
doi: 10.3390/ijms23031913.

ERAP2 Inhibition Induces Cell-Surface Presentation by MOLT-4 Leukemia Cancer Cells of Many Novel and Potentially Antigenic Peptides

Affiliations

ERAP2 Inhibition Induces Cell-Surface Presentation by MOLT-4 Leukemia Cancer Cells of Many Novel and Potentially Antigenic Peptides

Ioannis Temponeras et al. Int J Mol Sci. .

Abstract

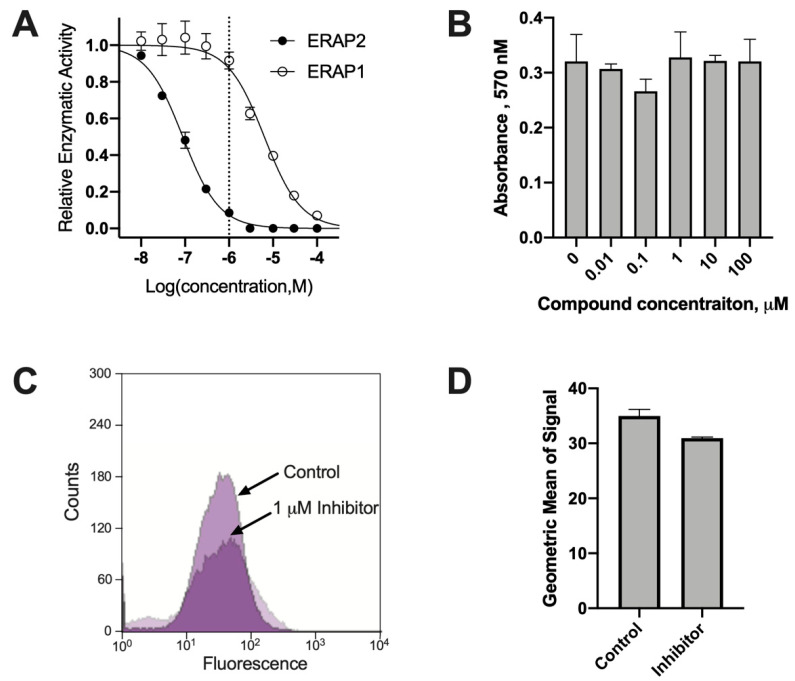
Recent studies have linked the activity of ER aminopeptidase 2 (ERAP2) to increased efficacy of immune-checkpoint inhibitor cancer immunotherapy, suggesting that pharmacological inhibition of ERAP2 could have important therapeutic implications. To explore the effects of ERAP2 inhibition on the immunopeptidome of cancer cells, we treated MOLT-4 T lymphoblast leukemia cells with a recently developed selective ERAP2 inhibitor, isolated Major Histocompatibility class I molecules (MHCI), and sequenced bound peptides by liquid chromatography tandem mass spectrometry. Inhibitor treatment induced significant shifts on the immunopeptidome so that more than 20% of detected peptides were either novel or significantly upregulated. Most of the inhibitor-induced peptides were 9mers and had sequence motifs and predicted affinity consistent with being optimal ligands for at least one of the MHCI alleles carried by MOLT-4 cells. Such inhibitor-induced peptides could serve as triggers for novel cytotoxic responses against cancer cells and synergize with the therapeutic effect of immune-checkpoint inhibitors.

Keywords: adaptive immunity; aminopeptidase; antigen presentation; antigenic peptide; immunopeptidome; inhibitor; major histocompatibility molecules; proteomics.


Conflict of interest statement

The authors declare that they have no competing financial interest.

Figures

Figure 1
Figure 1
Activity of the phosphinic inhibitor DG011A. Panel (A), titration of DG011A inhibits ERAP2 with a 70-fold higher potency than ERAP1. Panel (B), DG011A shows no toxicity versus MOLT-4 cells up to 100 μM as measured by the MTT assay. Panel (C), representative FACS traces used for the quantitation of the presence of HLA molecules (stained by the W6/32 antibody) on the surface of MOLT-4 cells incubated with 1 μM DG011A. Panel (D), quantitation of the geometric mean of the signal from the FACS experiments.
Figure 2
Figure 2
Effects of the DG011A on the immunopeptidome of MOLT-4 cells. Panel (A), scatterplot of the signal of detected peptides isolated from the HLA molecules of MOLT-4 cells under control conditions or after incubation with DG011A. Each circle represents a unique peptide sequence. Circles along the diagonal represent peptides unchanged between the two conditions and circles in the region close to each axis represent peptides detected only in a single condition (either control or inhibitor). Panel (B), heatplot showing the distribution of detected peptide signals (log10) in both conditions for each of the replicates measured (three biological replicates, each measured in three technical replicates, totaling 9 measurements per condition). Panel (C), volcano plot, indicating the statistical significance of the observed differences between the two conditions. Each circle represents a unique peptide sequence. The middle section represents peptides detected in both conditions but at different intensities and the outermost sections peptides detected in only a single condition. Peptides that fall within the green- and cyan-colored regions have a p value of <0.05 and are considered statistically significant. Panel (D), Venn diagram summarizing the observed numerical shifts of the immunopeptidome of MOLT-4 cells after incubation with DG011A.
Figure 3
Figure 3
Effects of the inhibitor DG011A on the length and affinity of peptides presented by MOLT-4 cells. Panel (A), distribution of lengths of peptide eluted from the MHC class I molecules on the surface of MOLT-4 cells that are unaffected by the presence of the inhibitor. Panel (B), same as in panel A but for peptides that were induced by the inhibitor. Panel (C), distribution of predicted affinities of each identified peptide for the HLA alleles present in MOLT-4 cells (HLA-A*01:01, HLA-A*25:01, HLA-B*18:01, HLA-B*57:01, HLA-C*06:02, HLA-C*12:03) [28]. Each circle denotes a unique peptide sequence. Peptides are grouped as in Panel (A).
Figure 4
Figure 4
Weblogo type plots based on Gibbs cluster analysis of 9mer sequences of identified peptides. Analysis was performed using the GibbsCluster-2.0 Server and plotted using the Seq2logo server. Amino acids are colored based on their physicochemical properties (negatively charged = red, positively charged = blue, hydrophobic/aromatic = black, hydrophilic = green). The size of the letter representation of each amino acid single letter code indicates the probability of observation at the particular position of each cluster. Positive value on the y-axis suggests a higher-than-random prevalence of the particular residue at that position. Positions that show the enhanced presence of residues that correspond to anchor residues of particular HLA alleles are indicated with arrows. Panels (A,B) indicate the two major clusters observed for peptides common in both control and inhibitor conditions and panels (C,D) indicate the two major clusters observed for peptides unique in the inhibitor-treated sample.
Figure 5
Figure 5
Synthetic strategy for DG011. (a) HMDS, 110 °C, 1 h, then 90 °C, 3 h, then EtOH, 70 °C, 30 min; (b) aq. NaOH, EtOH, rt, 24 h, then H3O+; (c) 2 × recrystallizations by AcOEt, 46%, three steps; (d) HBr/AcOH 33%, rt, 1 h; I Boc2O, Et3N, DMF, rt, 24 h, 92%, two steps; (e) H-(L)Ser(TBS)-NH2, EDC∙HCl, HOBt, DIPEA, CH2Cl2, rt, 4 h; (f) TFA/CH2Cl2/TIS/H2O 48:49:2:1, rt, 2 h, 43%, two steps.

Similar articles

Cited by

References

    1. Dunn G.P., Bruce A.T., Ikeda H., Old L.J., Schreiber R.D. Cancer immunoediting: From immunosurveillance to tumor escape. Nat. Immunol. 2002;3:991–998. doi: 10.1038/ni1102-991. - DOI - PubMed
    1. Robert C. A decade of immune-checkpoint inhibitors in cancer therapy. Nat. Commun. 2020;11:3801. doi: 10.1038/s41467-020-17670-y. - DOI - PMC - PubMed
    1. Sharma P., Hu-Lieskovan S., Wargo J.A., Ribas A. Primary, Adaptive, and Acquired Resistance to Cancer Immunotherapy. Cell. 2017;168:707–723. doi: 10.1016/j.cell.2017.01.017. - DOI - PMC - PubMed
    1. Rizvi N.A., Hellmann M.D., Snyder A., Kvistborg P., Makarov V., Havel J.J., Lee W., Yuan J., Wong P., Ho T.S., et al. Mutational landscape determines sensitivity to PD-1 blockade in non-small cell lung cancer. Science. 2015;348:124–128. doi: 10.1126/science.aaa1348. - DOI - PMC - PubMed
    1. Mpakali A., Stratikos E. The Role of Antigen Processing and Presentation in Cancer and the Efficacy of Immune Checkpoint Inhibitor Immunotherapy. Cancers. 2021;13:134. doi: 10.3390/cancers13010134. - DOI - PMC - PubMed

MeSH terms