Fusarium graminearum Infection Strategy in Wheat Involves a Highly Conserved Genetic Program That Controls the Expression of a Core Effectome
- PMID: 35163834
- PMCID: PMC8836836
- DOI: 10.3390/ijms23031914
Fusarium graminearum Infection Strategy in Wheat Involves a Highly Conserved Genetic Program That Controls the Expression of a Core Effectome
Abstract
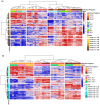
Fusarium graminearum, the main causal agent of Fusarium Head Blight (FHB), is one of the most damaging pathogens in wheat. Because of the complex organization of wheat resistance to FHB, this pathosystem represents a relevant model to elucidate the molecular mechanisms underlying plant susceptibility and to identify their main drivers, the pathogen's effectors. Although the F. graminearum catalog of effectors has been well characterized at the genome scale, in planta studies are needed to confirm their effective accumulation in host tissues and to identify their role during the infection process. Taking advantage of the genetic variability from both species, a RNAseq-based profiling of gene expression was performed during an infection time course using an aggressive F. graminearum strain facing five wheat cultivars of contrasting susceptibility as well as using three strains of contrasting aggressiveness infecting a single susceptible host. Genes coding for secreted proteins and exhibiting significant expression changes along infection progress were selected to identify the effector gene candidates. During its interaction with the five wheat cultivars, 476 effector genes were expressed by the aggressive strain, among which 91% were found in all the infected hosts. Considering three different strains infecting a single susceptible host, 761 effector genes were identified, among which 90% were systematically expressed in the three strains. We revealed a robust F. graminearum core effectome of 357 genes expressed in all the hosts and by all the strains that exhibited conserved expression patterns over time. Several wheat compartments were predicted to be targeted by these putative effectors including apoplast, nucleus, chloroplast and mitochondria. Taken together, our results shed light on a highly conserved parasite strategy. They led to the identification of reliable key fungal genes putatively involved in wheat susceptibility to F. graminearum, and provided valuable information about their putative targets.
Keywords: Fusarium graminearum; Triticum aestivum; effectoromics; in planta; plant–fungus interaction; susceptibility factors; transcriptomics.
Conflict of interest statement
The authors declare that they have no conflict of interest.
Figures


Similar articles
-
Comparative Genomics of Eight Fusarium graminearum Strains with Contrasting Aggressiveness Reveals an Expanded Open Pangenome and Extended Effector Content Signatures.Int J Mol Sci. 2021 Jun 10;22(12):6257. doi: 10.3390/ijms22126257. Int J Mol Sci. 2021. PMID: 34200775 Free PMC article.
-
Transcriptome dynamics of a susceptible wheat upon Fusarium head blight reveals that molecular responses to Fusarium graminearum infection fit over the grain development processes.Funct Integr Genomics. 2016 Mar;16(2):183-201. doi: 10.1007/s10142-016-0476-1. Epub 2016 Jan 21. Funct Integr Genomics. 2016. PMID: 26797431
-
The Fusarium graminearum Effector Protease FgTPP1 Suppresses Immune Responses and Facilitates Fusarium Head Blight Disease.Mol Plant Microbe Interact. 2025 Mar;38(2):297-314. doi: 10.1094/MPMI-08-24-0103-FI. Epub 2025 Apr 3. Mol Plant Microbe Interact. 2025. PMID: 39853238
-
Fusarium graminearum in Wheat-Management Strategies in Central Europe.Pathogens. 2025 Mar 8;14(3):265. doi: 10.3390/pathogens14030265. Pathogens. 2025. PMID: 40137750 Free PMC article. Review.
-
Advances in Understanding Fusarium graminearum: Genes Involved in the Regulation of Sexual Development, Pathogenesis, and Deoxynivalenol Biosynthesis.Genes (Basel). 2024 Apr 9;15(4):475. doi: 10.3390/genes15040475. Genes (Basel). 2024. PMID: 38674409 Free PMC article. Review.
Cited by
-
Unravelling ecophysiological and molecular adjustments in the photosynthesis-respiration balance during Fusarium graminearum infection in wheat spikes.Physiol Plant. 2025 Mar-Apr;177(2):e70150. doi: 10.1111/ppl.70150. Physiol Plant. 2025. PMID: 40091312 Free PMC article.
-
The SET domain protein PsKMT3 regulates histone H3K36 trimethylation and modulates effector gene expression in the soybean pathogen Phytophthora sojae.Mol Plant Pathol. 2023 Apr;24(4):346-358. doi: 10.1111/mpp.13301. Epub 2023 Feb 7. Mol Plant Pathol. 2023. PMID: 36748674 Free PMC article.
-
Integrative systems biology of wheat susceptibility to Fusarium graminearum uncovers a conserved gene regulatory network and identifies master regulators targeted by fungal core effectors.BMC Biol. 2024 Mar 5;22(1):53. doi: 10.1186/s12915-024-01852-x. BMC Biol. 2024. PMID: 38443953 Free PMC article.
-
Host-Pathogen Interaction 3.0.Int J Mol Sci. 2022 Oct 24;23(21):12811. doi: 10.3390/ijms232112811. Int J Mol Sci. 2022. PMID: 36361600 Free PMC article.
-
Update on the Basic Understanding of Fusarium graminearum Virulence Factors in Common Wheat Research.Plants (Basel). 2024 Apr 22;13(8):1159. doi: 10.3390/plants13081159. Plants (Basel). 2024. PMID: 38674569 Free PMC article. Review.
References
-
- Parry D.W., Jenkinson P., McLeod L. Fusarium Ear Blight (Scab) in Small Grain Cereals—A Review. Plant Pathol. 1995;44:207–238. doi: 10.1111/j.1365-3059.1995.tb02773.x. - DOI
-
- Boyacioǧlu D., Hettiarachchy N.S. Changes in Some Biochemical Components of Wheat Grain That Was Infected with Fusarium Graminearum. J. Cereal Sci. 1995;21:57–62. doi: 10.1016/S0733-5210(95)80008-5. - DOI
-
- Argyris J., Sanford D., TeKrony D. Fusarium Graminearum Infection during Wheat Seed Development and Its Effect on Seed Quality. Crop Sci. 2003;43:1782–1788. doi: 10.2135/cropsci2003.1782. - DOI
MeSH terms
Substances
Supplementary concepts
Grants and funding
LinkOut - more resources
Full Text Sources

