. 2022 Feb 8;23(3):1920.
doi: 10.3390/ijms23031920.

Erythrocyte Membrane Nanomechanical Rigidity Is Decreased in Obese Patients

Affiliations

Erythrocyte Membrane Nanomechanical Rigidity Is Decreased in Obese Patients

Jesús Sot et al. Int J Mol Sci. .

Abstract

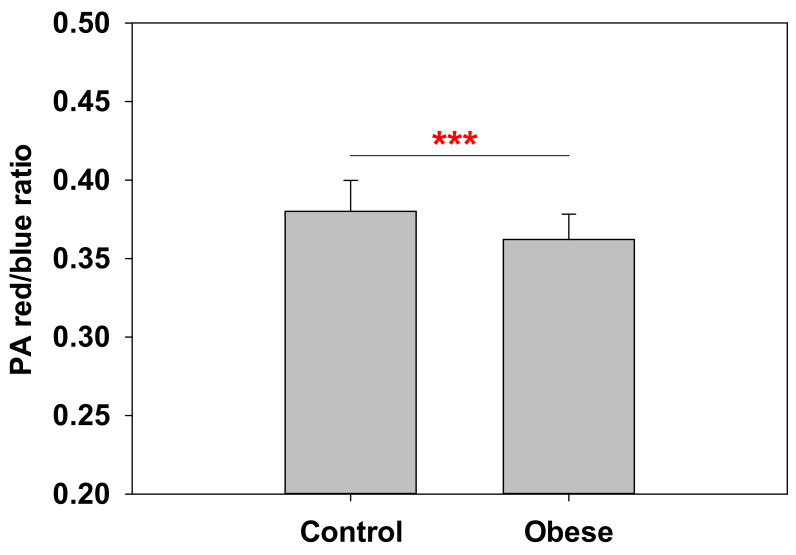
This work intends to describe the physical properties of red blood cell (RBC) membranes in obese adults. The hypothesis driving this research is that obesity, in addition to increasing the amount of body fat, will also modify the lipid composition of membranes in cells other than adipocytes. Forty-nine control volunteers (16 male, 33 female, BMI 21.8 ± 5.6 and 21.5 ± 4.2 kg/m2, respectively) and 52 obese subjects (16 male and 36 female, BMI 38.2± 11.0 and 40.7 ± 8.7 kg/m2, respectively) were examined. The two physical techniques applied were atomic force microscopy (AFM) in the force spectroscopy mode, which allows the micromechanical measurement of penetration forces, and fluorescence anisotropy of trimethylammonium diphenylhexatriene (TMA-DPH), which provides information on lipid order at the membrane polar-nonpolar interface. These techniques, in combination with lipidomic studies, revealed a decreased rigidity in the interfacial region of the RBC membranes of obese as compared to control patients, related to parallel changes in lipid composition. Lipidomic data show an increase in the cholesterol/phospholipid mole ratio and a decrease in sphingomyelin contents in obese membranes. ω-3 fatty acids (e.g., docosahexaenoic acid) appear to be less prevalent in obese patient RBCs, and this is the case for both the global fatty acid distribution and for the individual major lipids in the membrane phosphatidylcholine (PC), phosphatidylethanolamine (PE) and phosphatidylserine (PS). Moreover, some ω-6 fatty acids (e.g., arachidonic acid) are increased in obese patient RBCs. The switch from ω-3 to ω-6 lipids in obese subjects could be a major factor explaining the higher interfacial fluidity in obese patient RBC membranes.

Keywords: atomic force microscopy; cell membrane physical properties; fluorescence polarization; lipidomics; membrane breakthrough force; membrane fluidity; obesity.


Conflict of interest statement

The authors declare no conflict of interest.

Figures

Figure 1
Figure 1
Representative AFM force–distance curve of an RBC. The AFM tip performs an indentation process on a supported RBC, initiated from X = 0 along the red line (trace), up to the maximum force (20 nN in this case), and coming back to the initial position long the blue line (retrace). The trace line has three distinct phases: (i) first, an elastic deformation of the cell occurs (the force required for this process depends on the cell cytoskeleton); (ii) then, after further compression, the AFM tip pierces immediately through both RBC membranes (distal and proximal); and (iii) finally the tip achieves maximum force against the support, without further X-axis displacement. Membrane rupture is achieved at a definite force, marked by the sudden appearance of small peaks, at a Y-axis value that can be statistically quantitated (performing 50–75 curves for each sample). These experiments were performed at room temperature.
Figure 2
Figure 2
AFM force spectroscopy experiments on RBC. These measurements were performed at room temperature. Obese patient RBC are significantly less resistant to AFM punch-through experiments, pointing to a decrease in stiffness (number of patients n = 20 for control, n = 22 for obese; 50–75 measurements for each patient). Average values ± S.D. (*) Significance according to Student’s t-test: p = 0.03.
Figure 3
Figure 3
TMA-DPH anisotropy measurements of RBC membranes. The black bars represent measurements at 20 °C, while gray ones represent those at 37 °C. At both temperatures, a clear decrease for anisotropy values was detected for obese patient RBC, which indicates a higher membrane fluidity (n = 49 for control, n = 52 for obese). Average values ± S.D. Significance according to Student’s t-test: (**) p < 0.01; (***) p < 0.001.
Figure 4
Figure 4
Lipidomic quantitation of global fatty acid presence in mature RBCs. Empty boxes refer to control (normal weight) group, while gray boxes represent obese patients. Significant differences are detected for dihomo-γ-linolenic acid (DGLA), arachidonic acid, DHA levels, SFA/MUFA, and ω-6/ω-3 ratios, pointing to a metabolic switch for obese patient RBC membranes. Significance according to Student’s t-test: (*) p < 0.05; (**) p < 0.01; (***) p < 0.001. (n = 49 for control, n = 52 for obese).
Figure 5
Figure 5
Lipidomic quantitation of specific lipid species in RBC. Species studied were PC (A), PE (B), PS (C), SM (D), and Chol (E). Chol/total phospholipid mol ratio is shown in panel (F). Black bars refer to control RBC group, while gray bars represent the obese patient RBC group. A significant decrease in SM and an increase in Chol/phospholipid ratio were detected for obese patient RBC. Average values ± S.D. Significance according to Student’s t-test: (*) p < 0.05. n = 8.
Figure 6
Figure 6
Lipidomic analysis of ω-3 and ω-6 presence in specific lipid species. Percent ω-3 and/or ω-6 in PC (A), PE (B), and PS (C). Black bars refer to control RBC group, while gray bars represent the obese patient RBC group. While total values for combined ω-3 + ω-6 are constant, both a decrease in ω-3 and an increase in ω-6 are detected for each lipid species in obese patient RBC. Average values ± S.D. Significance according to Student’s t-test: (*) p < 0.05; (**) p < 0.01; (***) p < 0.001. n = 8.
Figure 7
Figure 7
PA probe measurements of blood plasma. Red/blue intensity ratio (RBIR) values for control and obese blood plasma revealed a highly significant reduction in obese patients. Experiments performed at 37 °C (n = 35 for control and n = 39 for obese). Average values ± S.D. Significance according to Student’s t-test: (***) p < 0.001.

References

    1. Bernotienė G., Dulskienė V., Klumbienė J., Kučienė R., Medžionienė J., Petkevičienė J., Petrauskienė A., Radišauskas R., Tamošiūnas A., Vaitkevičiūtė J. Heterogeneous contributions of change in population distribution of body mass index to change in obesity and underweight. Elife. 2021;10:e60060. - PMC - PubMed
    1. Schwartz M.W., Seeley R.J., Zeltser L.M., Drewnowski A., Ravussin E., Redman L.M., Leibel R.L. Obesity pathogenesis: An endocrine society scientific statement. Endocr. Rev. 2017;38:267–296. doi: 10.1210/er.2017-00111. - DOI - PMC - PubMed
    1. Flier J.S. Obesity wars: Molecular progress confronts an expanding epidemic. Cell. 2004;116:337–350. doi: 10.1016/S0092-8674(03)01081-X. - DOI - PubMed
    1. Perona J.S. Membrane lipid alterations in the metabolic syndrome and the role of dietary oils. Biochim. Et Biophys. Acta (BBA) Biomembr. 2017;1859:1690–1703. doi: 10.1016/j.bbamem.2017.04.015. - DOI - PubMed
    1. Cox M.M., Nelson D.L. Lehninger Principles of Biochemistry. Volume 5 WH Freeman; New York, NY, USA: 2008.

MeSH terms

Substances