

The System Profile of Renal Drug Transporters in Tubulointerstitial Fibrosis Model and Consequent Effect on Pharmacokinetics
- PMID: 35163972
- PMCID: PMC8838889
- DOI: 10.3390/molecules27030704
The System Profile of Renal Drug Transporters in Tubulointerstitial Fibrosis Model and Consequent Effect on Pharmacokinetics
Abstract
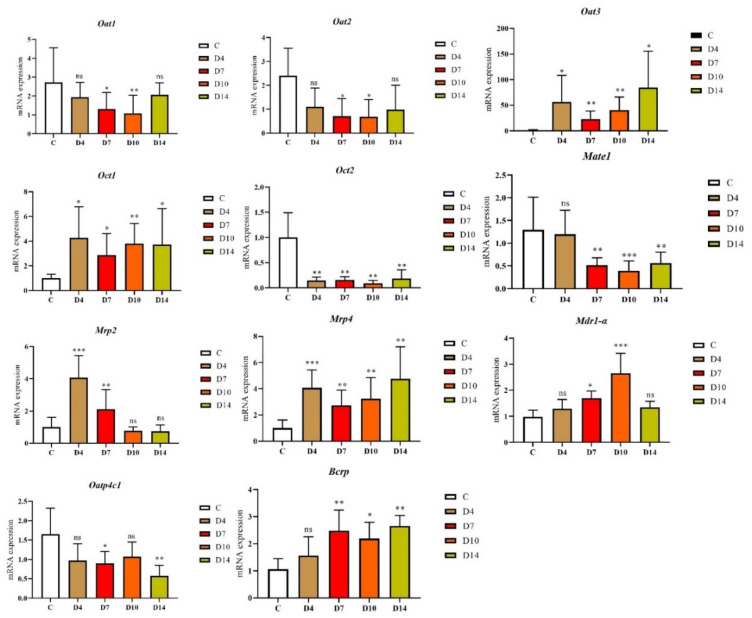
With the widespread clinical use of drug combinations, the incidence of drug-drug interactions (DDI) has significantly increased, accompanied by a variety of adverse reactions. Drug transporters play an important role in the development of DDI by affecting the elimination process of drugs in vivo, especially in the pathological state. Tubulointerstitial fibrosis (TIF) is an inevitable pathway in the progression of chronic kidney disease (CKD) to end-stage renal disease. Here, the dynamic expression changes of eleven drug transporters in TIF kidney have been systematically investigated. Among them, the mRNA expressions of Oat1, Oat2, Oct1, Oct2, Oatp4C1 and Mate1 were down-regulated, while Oat3, Mrp2, Mrp4, Mdr1-α, Bcrp were up-regulated. Pearson correlation analysis was used to analyze the correlation between transporters and Creatinine (Cr), OCT2 and MATE1 showed a strong negative correlation with Cr. In contrast, Mdr1-α exhibited a strong positive correlation with Cr. In addition, the pharmacokinetics of cimetidine, ganciclovir, and digoxin, which were the classical substrates for OCT2, MATE1 and P-glycoprotein (P-gp), respectively, have been studied. These results reveal that changes in serum creatinine can indicate changes in drug transporters in the kidney, and thus affect the pharmacokinetics of its substrates, providing useful information for clinical use.
Keywords: MATE1; OCT2; P-gp; drug transporters; pharmacokinetics.
Conflict of interest statement
The authors declare no conflict of interest.
Figures


Similar articles
-
Renal uptake of substrates for organic anion transporters Oat1 and Oat3 and organic cation transporters Oct1 and Oct2 is altered in rats with adenine-induced chronic renal failure.J Pharm Sci. 2013 Mar;102(3):1086-94. doi: 10.1002/jps.23433. Epub 2012 Dec 29. J Pharm Sci. 2013. PMID: 23280877
-
The Nonmetabolized β-Blocker Nadolol Is a Substrate of OCT1, OCT2, MATE1, MATE2-K, and P-Glycoprotein, but Not of OATP1B1 and OATP1B3.Mol Pharm. 2016 Feb 1;13(2):512-9. doi: 10.1021/acs.molpharmaceut.5b00733. Epub 2016 Jan 19. Mol Pharm. 2016. PMID: 26702643
-
Prediction of clinical drug-drug interactions of veliparib (ABT-888) with human renal transporters (OAT1, OAT3, OCT2, MATE1, and MATE2K).J Pharm Sci. 2013 Dec;102(12):4426-32. doi: 10.1002/jps.23737. Epub 2013 Oct 2. J Pharm Sci. 2013. PMID: 24122511
-
Renal Drug Transporters and Drug Interactions.Clin Pharmacokinet. 2017 Aug;56(8):825-892. doi: 10.1007/s40262-017-0506-8. Clin Pharmacokinet. 2017. PMID: 28210973 Review.
-
Transporter-mediated Natural Product-Drug Interactions.Planta Med. 2023 Feb;89(2):119-133. doi: 10.1055/a-1803-1744. Epub 2022 Mar 18. Planta Med. 2023. PMID: 35304735 Review.
Cited by
-
Renal organic anion transporter 1: clinical relevance and the underlying mechanisms in chronic kidney disease.BMC Nephrol. 2025 Feb 24;26(1):93. doi: 10.1186/s12882-025-03974-y. BMC Nephrol. 2025. PMID: 39994543 Free PMC article. Review.
-
Beyond ADME: The Endogenous Functions of Drug Transporters and Its Impact on Human Disease.Pharmaceutics. 2025 May 23;17(6):685. doi: 10.3390/pharmaceutics17060685. Pharmaceutics. 2025. PMID: 40573999 Free PMC article. Review.
References
-
- Zamek-Gliszczynski M.J., Patel M., Yang X., Lutz J.D., Chu X., Brouwer K.L.R., Lai Y., Lee C.A., Neuhoff S., Paine M.F., et al. Intestinal P-gp and Putative Hepatic OATP1B Induction: International Transporter Consortium Perspective on Drug Development Implications. Clin. Pharmacol. Ther. 2021;109:55–64. doi: 10.1002/cpt.1916. - DOI - PMC - PubMed
-
- Dalrymple L.S., Katz R., Kestenbaum B., Shlipak M.G., Sarnak M.J., Stehman-Breen C., Seliger S., Siscovick D., Newman A.B., Fried L. Chronic Kidney Disease and the Risk of End-Stage Renal Disease Versus Death. J. Gen. Intern. Med. 2010;26:379–385. doi: 10.1007/s11606-010-1511-x. - DOI - PMC - PubMed
-
- Evans M., Lewis R.D., Morgan A.R., Whyte M.B., Hanif W., Bain S.C., Davies S., Dashora U., Yousef Z., Patel D.C., et al. A Narrative Review of Chronic Kidney Disease in Clinical Practice: Current Challenges and Future Perspectives. Adv. Ther. 2021:1–11. doi: 10.1007/s12325-021-01927-z. - DOI - PMC - PubMed
MeSH terms
Substances
Grants and funding
- 2021A1515011604/Guangdong Basic and Applied Basic Research Foundation
- 2018030310286/Natural Science Foundation of Guangdong Province
- 2019B020202002/Major Scientific and Technological Projects of Guangdong Province
- 202112121385/innovation and entrepreneurship training program for college students of Southern Medical University
LinkOut - more resources
Full Text Sources
Medical
Miscellaneous
