. 2022 Jan 28;27(3):914.
doi: 10.3390/molecules27030914.

Healthy Properties of a New Formulation of Pomegranate-Peel Extract in Mice Suffering from Experimental Autoimmune Encephalomyelitis

Affiliations

Healthy Properties of a New Formulation of Pomegranate-Peel Extract in Mice Suffering from Experimental Autoimmune Encephalomyelitis

Giulia Vallarino et al. Molecules. .

Erratum in

Abstract

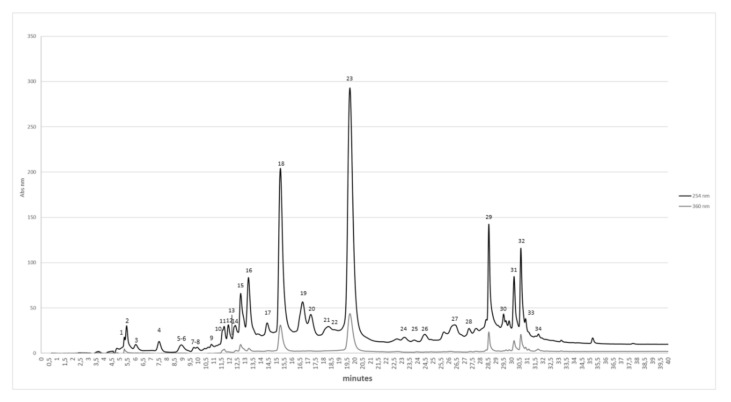
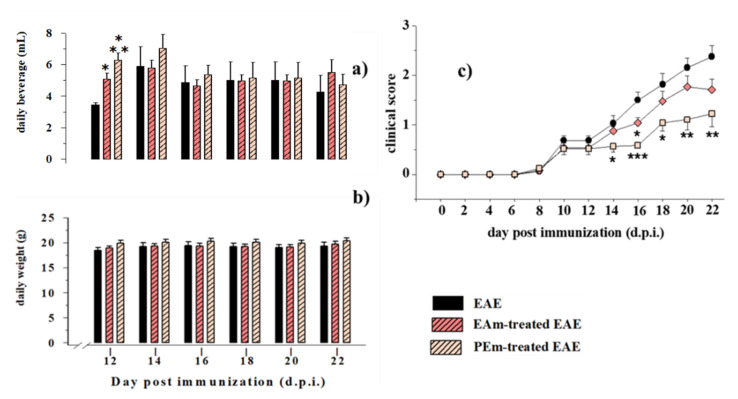
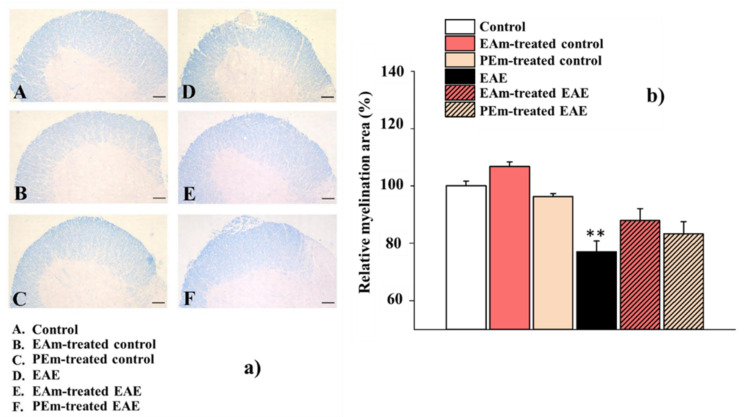
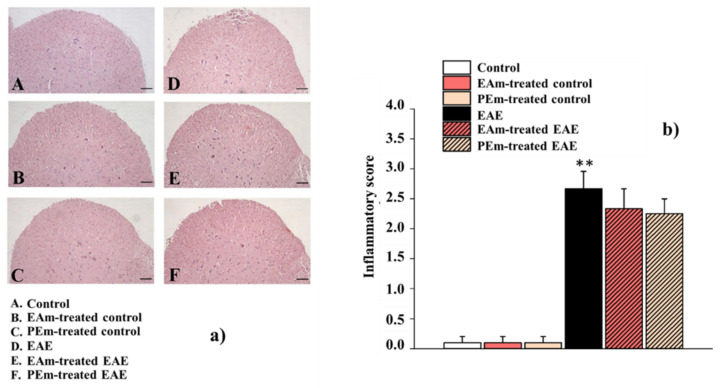
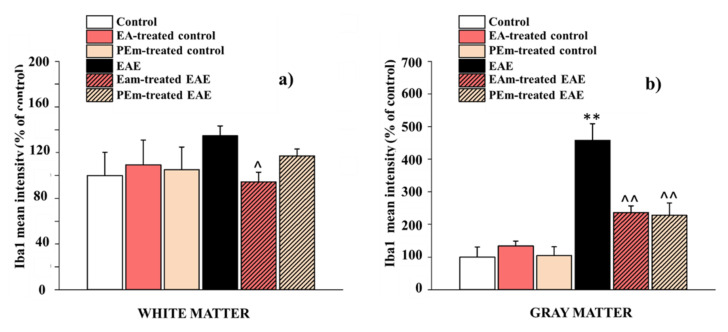
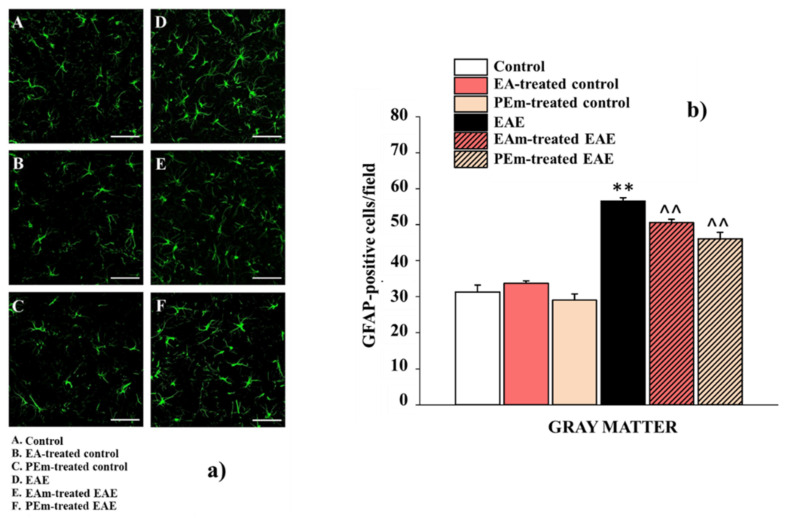
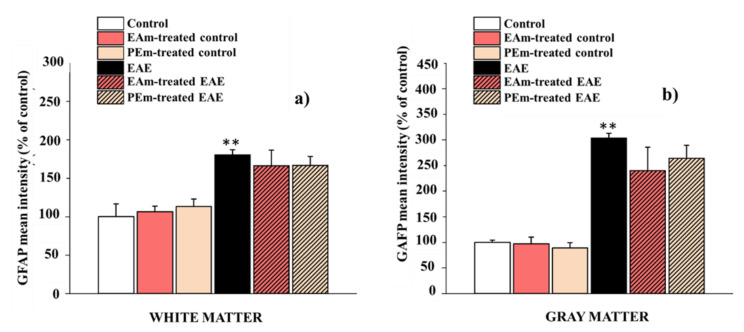
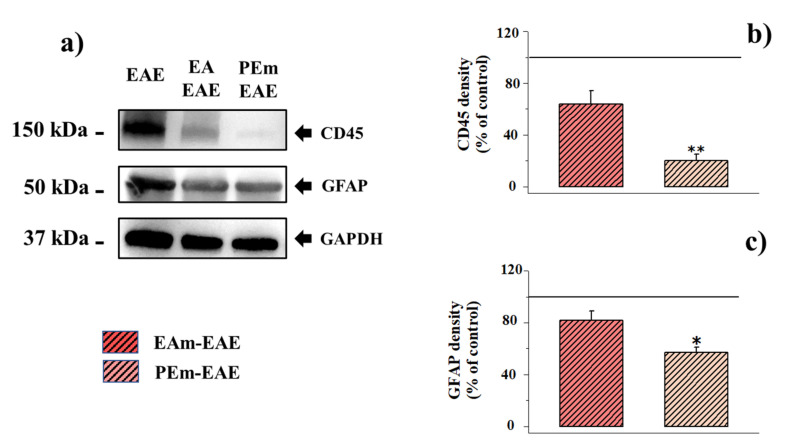
A new formulation of a pomegranate-peel extract (PEm) obtained by PUAE (Pulsed Ultrasound-Assisted Extraction) and titrated in both ellagic acid (EA) and punicalagin is proposed, characterized and then analyzed for potential health properties in mice suffering from the experimental autoimmune encephalomyelitis (EAE). PEm effects were compared to those elicited by a formulation containing EA (EAm). Control and EAE mice were chronically administered EAm and Pem dissolved in the drinking water, starting from the day 10 post-immunization (d.p.i.), with a "therapeutic" protocol to deliver daily 50 mg/kg of EA. Treated EAE mice did not limit their daily access to the beverage, nor did they show changes in body weight, but they displayed a significant amelioration of "in vivo" clinical symptoms. "Ex vivo" histochemical analysis showed that spinal-cord demyelination and inflammation in PEm and EAm-treated EAE mice at 23 ± 1 d.p.i. were comparable to those in the untreated EAE animals, while microglia activation (measured as Ionized Calcium Binding Adaptor 1, Iba1 staining) and astrocytosis (quantified as glial fibrillar acid protein, GFAP immunopositivity) significantly recovered, particularly in the gray matter. EAm and PEm displayed comparable efficiencies in controlling the spinal pathological cellular hallmarks in EAE mice, and this would support their delivery as dietary supplementation in patients suffering from multiple sclerosis (MS).

Keywords: astrocytosis; demyelination; ellagic acid; inflammation; multiple sclerosis; pomegranate peels.


Conflict of interest statement

The authors declare no conflict of interest.

Figures

Figure 1
Figure 1
HPLC chromatograms identified by ESI/MS–MS/MS analysis, at 254 nm (black line) and 360 nm (gray line). The numbering corresponds to that reported in Table 3.
Figure 2
Figure 2
Effects of “in vivo” EAm and PEm treatments on daily beverage intake, weight and clinical score of EAE mice. (a) Daily beverage intake (mL) in untreated (n = 8 mice), EAm-treated (n = 12 mice) and PEm-treated (n = 12) EAE mice. The daily intake is expressed as mean ± SEM of the drinking solution (mL) taken up. (b) Animal weight (g) in untreated, EAm-treated and PEm-treated EAE mice (number of mice for each group as above). The values are expressed as mean ± SEM of the animal weight (g). (c) Clinical scores of untreated, EAm-treated and PEm-treated EAE mice. PEm and EAm treatment started at 10 d.p.i. (see arrow). The clinical score is evaluated as indicated in the Method section, and it is expressed as mean ± SEM (number of mice for group as above). All of these values were measured every two days, at the indicated day, post-immunization (d.p.i.). Note: * p < 0.05 vs. untreated EAE mice, ** p < 0.01 vs. untreated EAE mice and *** p < 0.001 vs. untreated EAE mice.
Figure 3
Figure 3
Effects of “in vivo” EAm and PEm treatments on the demyelination in the spinal cord of EAE mice. (a) Representative images of ventral-horn white matter marked by Luxol Fast Blue staining (total magnification, 100×; scale bar, 100 µm). (b) Quantitative evaluation of average LFB burden. Results are expressed as mean ± SEM of 4 animals per group and controls arbitrary taken as 100%. Note: ** p < 0.01 vs. control.
Figure 4
Figure 4
Effects of “in vivo” EAm and PEm treatments on inflammation in the spinal cord of EAE mice. (a) Representative images of ventral spinal cord marked by Hematoxylin and Eosin staining (total magnification: 100×. Scale bar: 100 µm) and quantitative evaluation of inflammatory infiltrate. The values represent the mean ± SEM of 4 animals per group. (b) Quantitative evaluation of inflammatory infiltrate. The values represent the mean ± SEM of 4 animals per group. Note: ** p < 0.01 vs. control.
Figure 5
Figure 5
Effects of “in vivo” EAm and PEm treatments on the microglial profile in the spinal cord. (a) Representative images obtained by Iba-1 immunofluorescence histochemistry of the ventral spinal cord, lumbar portion (total magnification, 400×; scale bar, 50 µm). (b) Quantitative analysis for Iba-1-positive cells/field in the ventral gray matter. Results are expressed as mean ± SEM of n = 4 animals per group. Note: ** p < 0.01 vs. control group; ^ p < 0.05 or ^^ p < 0.01 vs. EAE group.
Figure 6
Figure 6
Effects of “in vivo” EAm and PEm treatments on the microglial profile in the gray and the white matters in the spinal cord. The histograms show the quantitative analysis for Iba-1 mean fluorescence intensity in the white matter (a) and in the gray matter (b) of the ventral spinal cord. Results are expressed as mean ± SEM of 4 animals per group and control is arbitrary taken as 100%. Note: ** p < 0.01 vs. control group; ^ p < 0.05 or ^^ p < 0.01 vs. EAE group.
Figure 7
Figure 7
Effects of “in vivo” EAm and PEm treatments on the astrocytic profile in the spinal cord. (a) Representative images obtained by GFAP immunofluorescence histochemistry of the ventral spinal cord (lumbar portion; total magnification, 400×; scale bar, 50 µm). (b) Quantitative analysis for GFAP-positive cells/field in the ventral gray matter. Results are expressed as mean ± SEM of 4 animals per group. Note: ** p < 0.01 vs. control group; ^^ p < 0.01 vs. EAE group.
Figure 8
Figure 8
Effects of “in vivo” EAm and PEm treatments on “in vitro” astrocytic profile in the spinal-cord gray and white matter. The histograms show the quantitative analysis for GFAP mean fluorescence intensity in the white matter (a) and in the gray matter (b) of the ventral spinal cord. Results are expressed as mean ± SEM of 4 animals per group, and control is arbitrary, taken as 100%. Note: ** p < 0.01 vs. control group.
Figure 9
Figure 9
Effect of “in vivo” EAm and PEm treatments on the content of CD45 and of the glial fibrillar astrocytic protein (GFAP) in EAE mouse spinal-cord homogenates. (a) Representative Western blot of the immunostainings for CD45, GFAP and glyceraldehyde-3-phosphate dehydrogenase (GAPDH) in untreated, EAm-treated and PEm-treated EAE mouse spinal-cord homogenates. The protein GAPDH was used as the internal control. The blot is representative of the analysis on lysates from 6 animals for each experimental group. (b) Quantification of the change of CD45 density in the spinal-cord homogenates of EAm-treated (n = 6 mice) and PEm-treated (n = 6 mice) EAE mice versus the untreated ones (n = 6). Results are calculated as CD45 ÷ GAPDH ratio and are expressed as percentage of the respective ratio in untreated EAE mice (1.12 ± 0.22). Data are expressed as mean ± SEM. (c). Quantification of the change of GFAP density in the spinal cord homogenates of EAm-treated (n = 6 mice) and PEm-treated (n = 6 mice) EAE mice versus that of untreated ones (n = 6). Results are calculated as GFAP ÷ GAPDH ratio and are expressed as percentage of the respective ratio in untreated EAE mice (3.52 ± 0.41). Data are expressed as mean ± SEM. Note: * p < 0.05 versus untreated EAE mice; ** p < 0.01 versus untreated EAE mice. EA and PEm administration did not cause significant changes in the expression of the CD45 and the GFAP protein densities in control mice.

References

    1. Farinotti M., Vacchi L., Simi S., Di Pietrantonj C., Brait L., Filippini G. Dietary Interventions for Multiple Sclerosis. Cochrane Database Syst. Rev. 2012;12:CD004192. doi: 10.1002/14651858.CD004192.pub3. - DOI - PubMed
    1. Boggia R., Turrini F., Villa C., Lacapra C., Zunin P., Parodi B. Green Extraction from Pomegranate Marcs for the Production of Functional Foods and Cosmetics. Pharmaceuticals. 2016;9:63. doi: 10.3390/ph9040063. - DOI - PMC - PubMed
    1. Parisio C., Lucarini E., Micheli L., Toti A., Khatib M., Mulinacci N., Calosi L., Bani D., Di Cesare Mannelli L., Ghelardini C. Pomegranate Mesocarp against Colitis-Induced Visceral Pain in Rats: Effects of a Decoction and Its Fractions. Int. J. Mol. Sci. 2020;21:4304. doi: 10.3390/ijms21124304. - DOI - PMC - PubMed
    1. Ahmed T., Setzer W.N., Nabavi S.F., Orhan I.E., Braidy N., Sobarzo-Sanchez E., Nabavi S.M. Insights Into Effects of Ellagic Acid on the Nervous System: A Mini Review. Curr. Pharm. Des. 2016;22:1350–1360. doi: 10.2174/1381612822666160125114503. - DOI - PubMed
    1. Alfei S., Turrini F., Catena S., Zunin P., Grilli M., Pittaluga A.M., Boggia R. Ellagic Acid a Multi-Target Bioactive Compound for Drug Discovery in CNS? A Narrative Review. Eur. J. Med. Chem. 2019;183:111724. doi: 10.1016/j.ejmech.2019.111724. - DOI - PubMed

MeSH terms