. 2022 Feb 1;27(3):997.
doi: 10.3390/molecules27030997.

Semi-Quantitative MALDI Measurements of Blood-Based Samples for Molecular Diagnostics

Affiliations

Semi-Quantitative MALDI Measurements of Blood-Based Samples for Molecular Diagnostics

Matthew A Koc et al. Molecules. .

Abstract

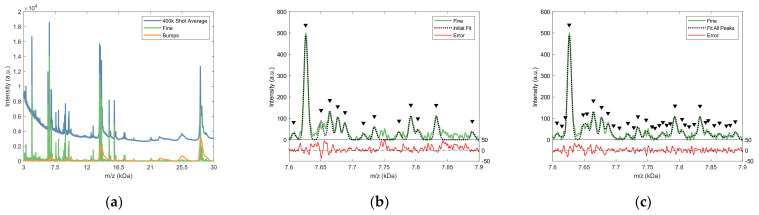
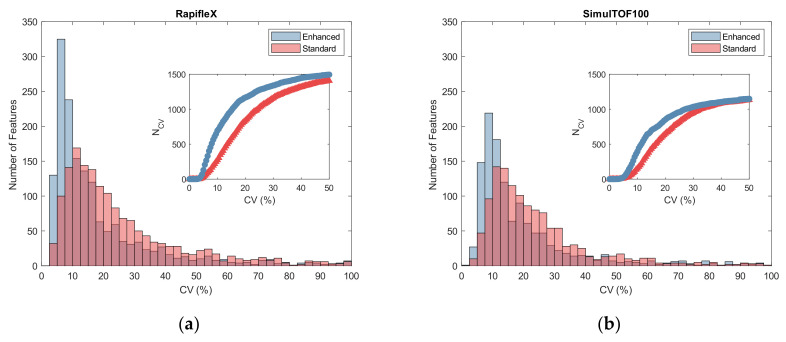
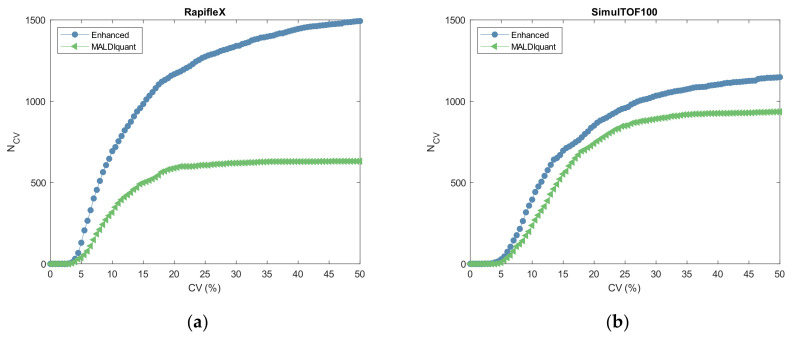
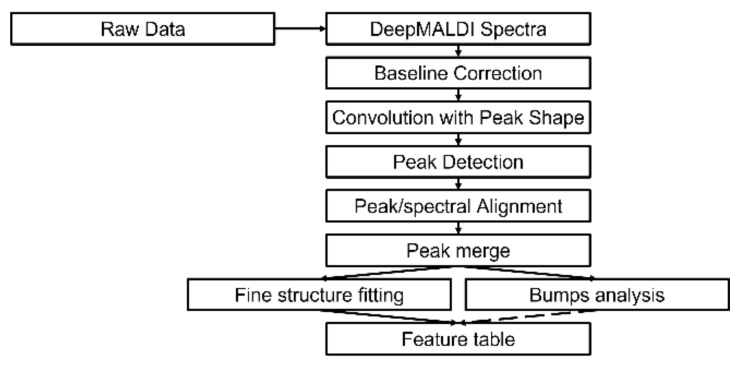
Accurate and precise measurement of the relative protein content of blood-based samples using mass spectrometry is challenging due to the large number of circulating proteins and the dynamic range of their abundances. Traditional spectral processing methods often struggle with accurately detecting overlapping peaks that are observed in these samples. In this work, we develop a novel spectral processing algorithm that effectively detects over 1650 peaks with over 3.5 orders of magnitude in intensity in the 3 to 30 kD m/z range. The algorithm utilizes a convolution of the peak shape to enhance peak detection, and accurate peak fitting to provide highly reproducible relative abundance estimates for both isolated peaks and overlapping peaks. We demonstrate a substantial increase in the reproducibility of the measurements of relative protein abundance when comparing this processing method to a traditional processing method for sample sets run on multiple matrix-assisted laser desorption/ionization-time of flight (MALDI-TOF) instruments. By utilizing protein set enrichment analysis, we find a sizable increase in the number of features associated with biological processes compared to previously reported results. The new processing method could be very beneficial when developing high-performance molecular diagnostic tests in disease indications.

Keywords: mass spectrometry; peak detection; proteomics; set enrichment analysis; spectral processing.


Conflict of interest statement

All authors are current employees of and have or had stock options in Biodesix, Inc. H.R., J.R., and S.A. are inventors on patents describing Deep MALDI TOF mass spectrometry of complex biological samples, assigned to Biodesix, Inc.

Figures

Figure 1
Figure 1
Example spectra collected on the RapifleX of an individual raster spectrum (black) and a 400,000 shot Deep MALDI averaged spectrum (red) from 7.5 to 9 kDa m/z range. The inset shows the same spectra over the full 3 to 30 kDa range analyzed in this work.
Figure 2
Figure 2
Spectral component analysis showing the baseline corrected Deep MALDI spectrum (black), fine structure (green), and bumps (orange) for peak clusters around (a) 14 kDa and (b) 21 kDa.
Figure 3
Figure 3
Peak shape determination of Bruker RapifleX MALDI-TOF spectral peaks. (a) Raw sample data (black stars) and peak fit to an asymmetric (blue-solid) and symmetric (red-dashed) Gaussian. Fit error is shown by the dotted lines. (b) Peak shape parameters as a function of m/z. Overall fitted trend is shown with solid lines and the linear (dashed) and quadratic (dotted) piecewise portions for σL and σR of the fits are extended past the trend range for reader visibility.
Figure 4
Figure 4
Example of a 400,000 shot-averaged Deep MALDI spectrum collected on the RapifleX and the associated Eilers’ background estimation.
Figure 5
Figure 5
Visual representation of peak fitting and feature value determination. (a) A single-processed Deep MALDI spectrum showing the fine structure (green) and bumps (yellow) components. (b) Initial peak finding and result of applying the fitting algorithm to the fine structure of a single spectrum in the range 7.5–7.9 kDa. (c) The complete fitting of the same range using the master list of all peaks. The triangles indicate locations of fitted peaks and the red trace at the bottom shows the error in the peak fit.
Figure 6
Figure 6
Reproducibility of feature values for a single sample over 20 preparations and acquisitions collected on the (a) RapifleX and (b) SimulTOF100. Histograms of CVs for standard (red) and enhanced (blue) feature values are shown in the main plot. The inset shows the cumulative CV distribution, NCV, for the standard (red, triangles) and enhanced feature values (blue, circles) (only CVs up to 50% are shown for clarity).
Figure 7
Figure 7
Comparison of reproducibility of our approach to a published method, MALDIquant. Cumulative CV distribution, NCV, for the same Deep MALDI spectra analyzed with the presented methods using enhanced feature values (blue, circles) and with MALDIquant processing (green, triangles) for: (a) RapifleX and (b) SimulTOF100 acquisitions. Only CVs up to 50% are shown for clarity.
Scheme 1
Scheme 1
Spectral analysis workflow for mass spectrometer data using presented preprocessing methods.

References

    1. Bast R., Jr., Xu F.-J., Yu Y.-H., Barnhill S., Zhang Z., Mills G. CA 125: The Past and the Future. Int. J. Biol. Markers. 1998;13:179–187. doi: 10.1177/172460089801300402. - DOI - PubMed
    1. Scarà S., Bottoni P., Scatena R. CA 19-9: Biochemical and Clinical Aspects. Adv. Cancer Biomark. 2015;867:247–260. doi: 10.1007/978-94-017-7215-0_15. - DOI - PubMed
    1. Dorcely B., Katz K., Jagannathan R., Chiang S.S., Oluwadare B., Goldberg I.J., Bergman M. Novel Biomarkers for Prediabetes, Diabetes, and Associated Complications. Diabetes Metab. Syndr. Obes. Targets Ther. 2017;10:345. doi: 10.2147/DMSO.S100074. - DOI - PMC - PubMed
    1. Patel S.P., Kurzrock R. PD-L1 Expression as a Predictive Biomarker in Cancer Immunotherapy. Mol. Cancer Ther. 2015;14:847–856. doi: 10.1158/1535-7163.MCT-14-0983. - DOI - PubMed
    1. Johnson P.J., Pirrie S.J., Cox T.F., Berhane S., Teng M., Palmer D., Morse J., Hull D., Patman G., Kagebayashi C., et al. The Detection of Hepatocellular Carcinoma Using a Prospectively Developed and Validated Model Based on Serological Biomarkers. Cancer Epidemiol. Prev. Biomark. 2014;23:144–153. doi: 10.1158/1055-9965.EPI-13-0870. - DOI - PubMed

MeSH terms