. 2021 Feb 22;13(1):e0373421.
doi: 10.1128/mbio.03734-21. Epub 2022 Feb 15.

Carbon Catabolite Repression Governs Diverse Physiological Processes and Development in Aspergillus nidulans

Affiliations

Carbon Catabolite Repression Governs Diverse Physiological Processes and Development in Aspergillus nidulans

Yingying Chen et al. mBio. .

Abstract

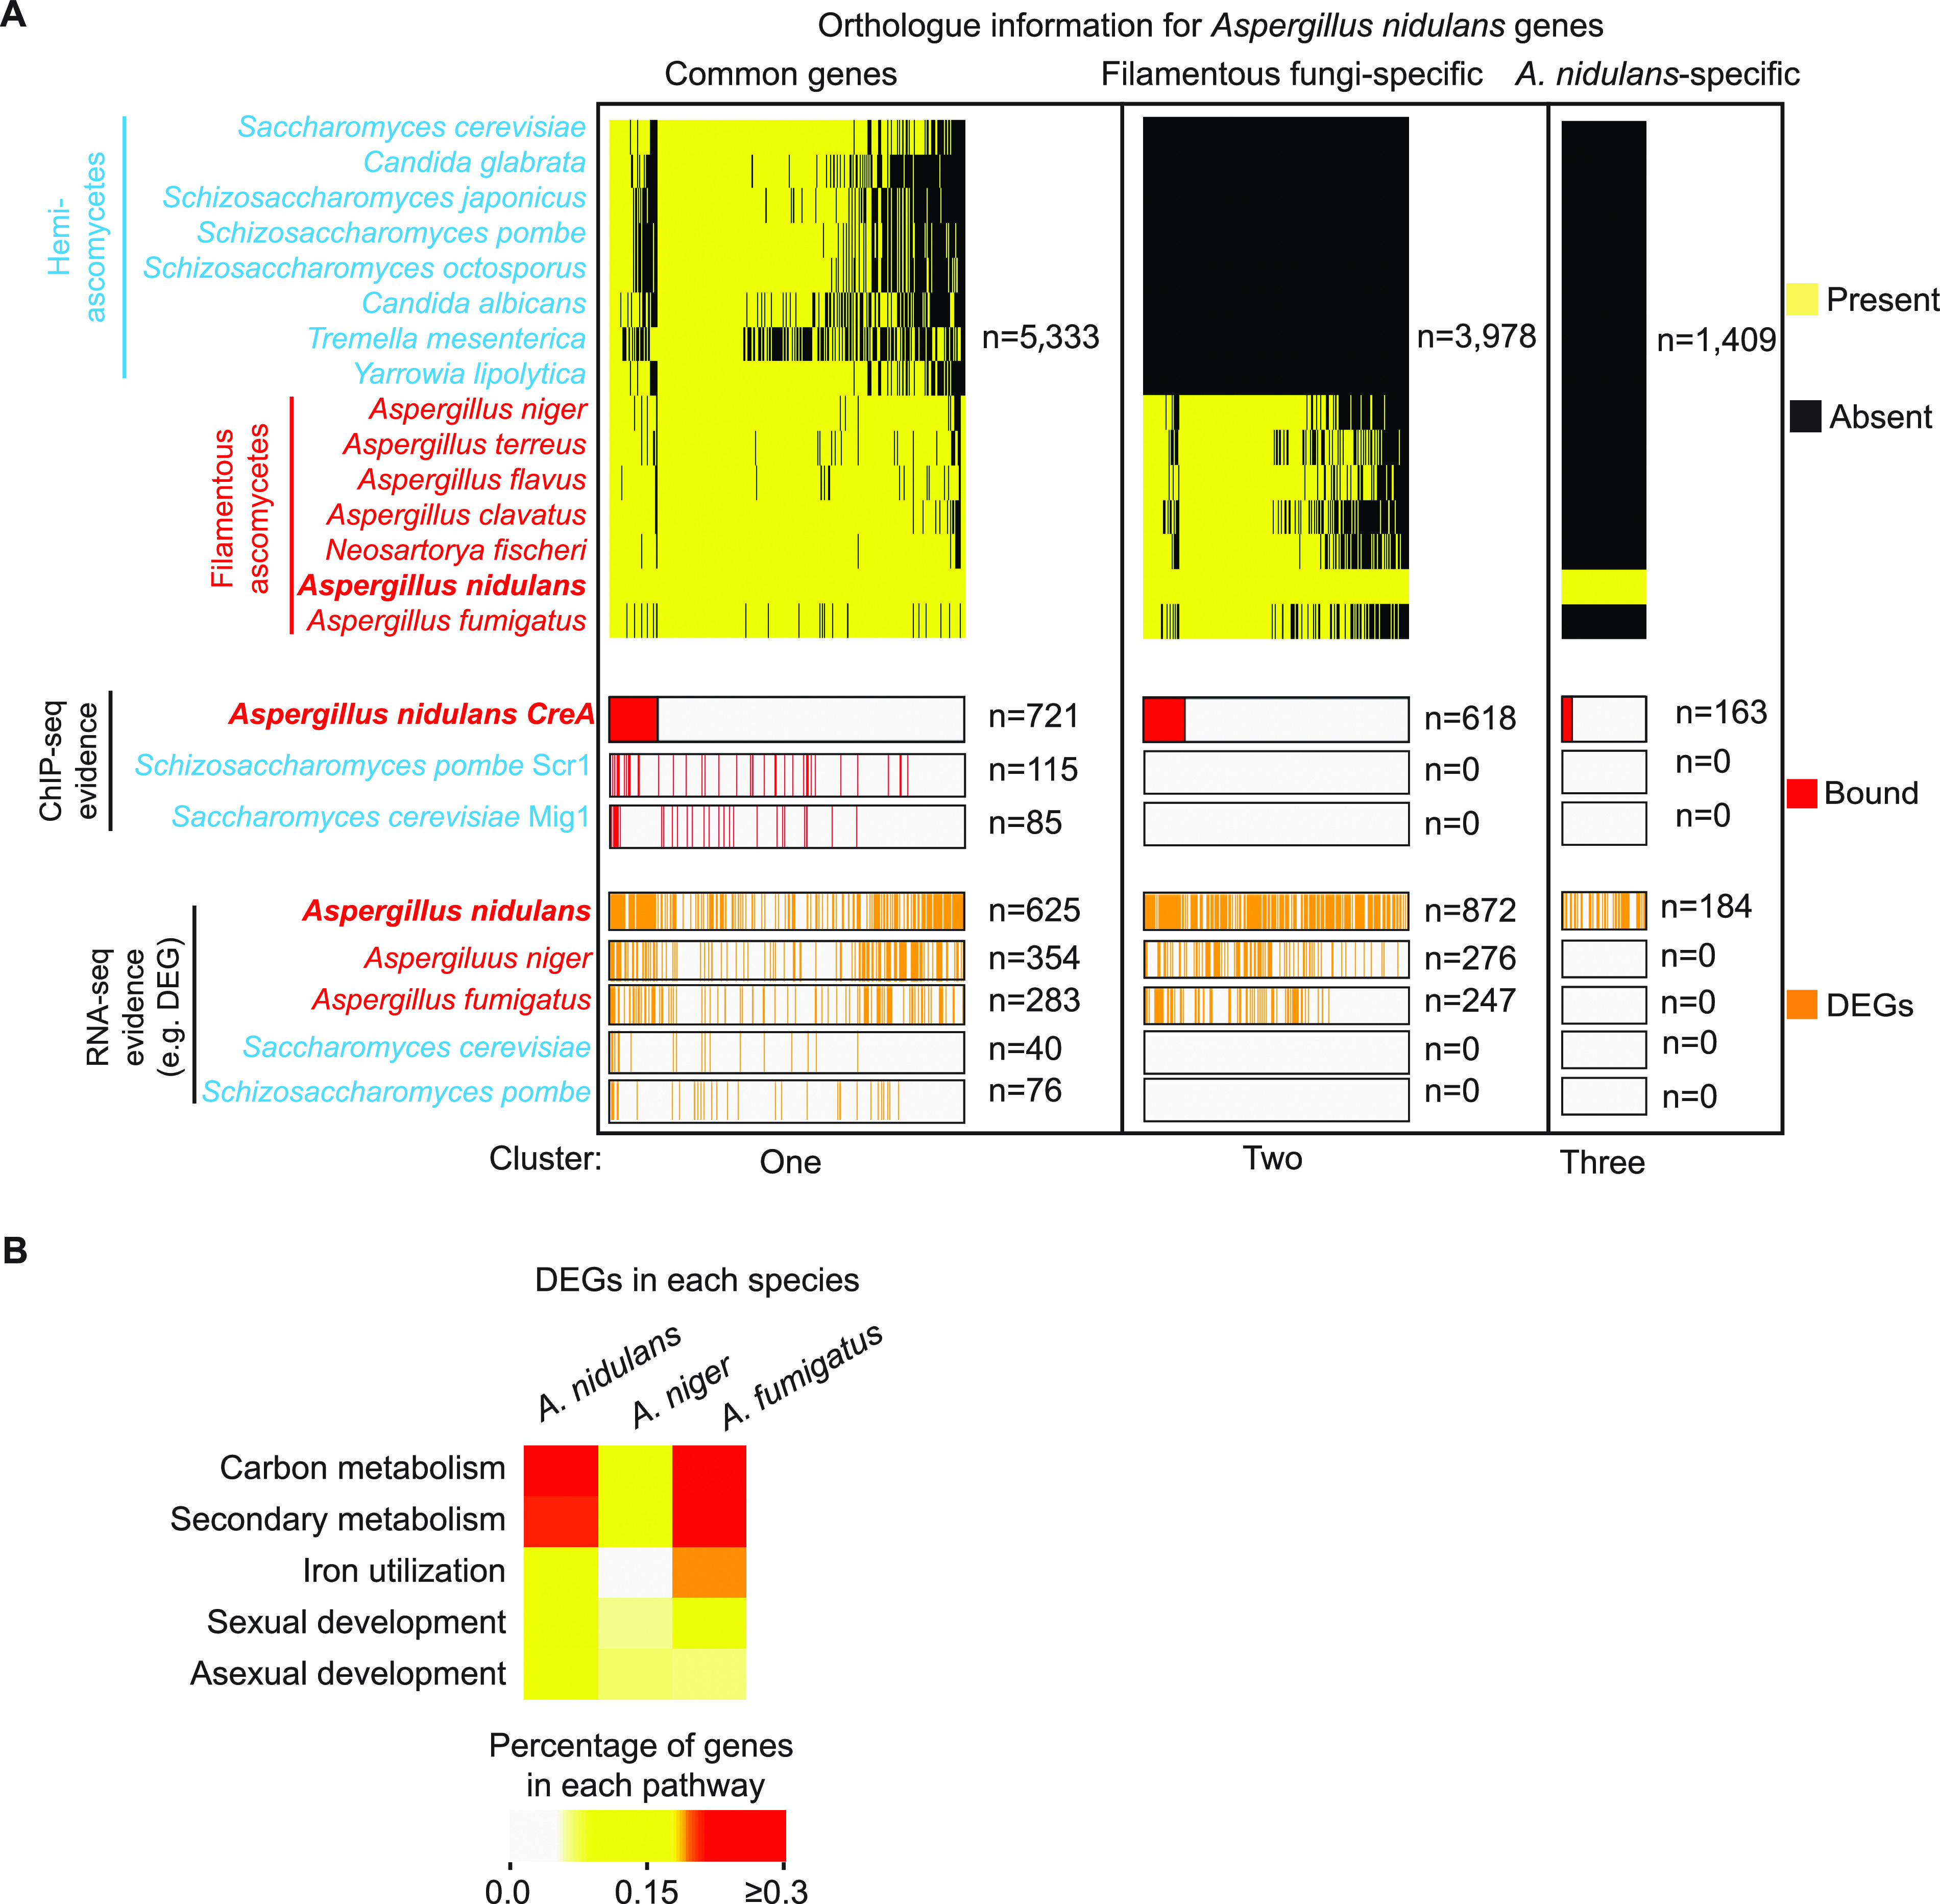
Carbon catabolite repression (CCR) is a common phenomenon of microorganisms that enable efficient utilization of carbon nutrients, critical for the fitness of microorganisms in the wild and for pathogenic species to cause infection. In most filamentous fungal species, the conserved transcription factor CreA/Cre1 mediates CCR. Previous studies demonstrated a primary function for CreA/Cre1 in carbon metabolism; however, the phenotype of creA/cre1 mutants indicated broader roles. The global function and regulatory mechanism of this wide-domain transcription factor has remained elusive. Here, we applied two powerful genomics methods (transcriptome sequencing and chromatin immunoprecipitation sequencing) to delineate the direct and indirect roles of Aspergillus nidulans CreA across diverse physiological processes, including secondary metabolism, iron homeostasis, oxidative stress response, development, N-glycan biosynthesis, unfolded protein response, and nutrient and ion transport. The results indicate intricate connections between the regulation of carbon metabolism and diverse cellular functions. Moreover, our work also provides key mechanistic insights into CreA regulation and identifies CreA as a master regulator controlling many transcription factors of different regulatory networks. The discoveries for this highly conserved transcriptional regulator in a model fungus have important implications for CCR in related pathogenic and industrial species. IMPORTANCE The ability to scavenge and use a wide range of nutrients for growth is crucial for microorganisms' survival in the wild. Carbon catabolite repression (CCR) is a transcriptional regulatory phenomenon of both bacteria and fungi to coordinate the expression of genes required for preferential utilization of carbon sources. Since carbon metabolism is essential for growth, CCR is central to the fitness of microorganisms. In filamentous fungi, CCR is mediated by the conserved transcription factor CreA/Cre1, whose function in carbon metabolism has been well established. However, the global roles and regulatory mechanism of CreA/Cre1 are poorly defined. This study uncovers the direct and indirect functions of CreA in the model organism Aspergillus nidulans over diverse physiological processes and development and provides mechanistic insights into how CreA controls different regulatory networks. The work also reveals an interesting functional divergence between filamentous fungal and yeast CreA/Cre1 orthologues.

Keywords: carbon catabolite repression; carbon metabolism; fungal physiology; gene regulation; transcription factor.


Conflict of interest statement

The authors declare no conflict of interest.

Figures

FIG 1
FIG 1
RNA-seq analysis reveals the effect of creA deletion on more than a thousand genes under CCR conditions. (A) A volcano plot displaying gene expression changes between the wild type (WT) and the creAΔ mutant. The x axis shows log10 fold change (FC) between the WT and the creAΔ mutant, while the y axis presents −log10 adjusted P values. The significantly up- and downregulated genes are shown in red and blue, respectively. (B) A bar plot presenting the representative KEGG pathways for the DEGs between the WT and the creAΔ mutant. KEGG pathways of upregulated and downregulated genes are colored in red and blue, respectively.
FIG 2
FIG 2
ChIP-seq analysis reveals direct CreA binding to thousands of genomic locations under CCR conditions. (A) Genome browser screenshots showing CreAHA (in blue) and CreAGFP (in green) ChIP-seq signals at the promoter of ethanol, xylose, and starch metabolism genes and the creA gene. ChIP signals in wild-type nontagged strains were shown as a negative control. The upper display threshold set on the genome browser for each screenshot is indicated by the scale bar on the right. (B) A bar chart showing the distribution of CreA binding summits at promoters. The distance between each summit to the translation start site (ATG) of the closest gene annotation is presented. (C) A genome browser screenshot showing CreAHA (in blue) and CreAGFP (in green) ChIP-seq signals and peak summits (marked by red bars) identified by MACS2 at the pmaA promoter. The upper display threshold set on the genome browser for each screenshot is indicated by the scale bar on the right. (D) A pie chart showing the percentages of CreA-bound genes with different transcriptional consequences. (E) A heatmap plot showing gene expression values and changes (in the creAΔ mutant relative to the wild type [WT]) for a few established CreA-bound transcription factors regulating carbon metabolism. (F) Heatmaps displaying gene expression changes for starch, ethanol, xylose, and rhamnose metabolism genes in the creAΔ mutant relative to the WT. The presence of CreA binding at their promoters is indicated by a yellow circle. (G) Genome browser screenshots showing CreAHA (in blue) and CreAGFP (in green) ChIP-seq signals at the promoter of amyR, alcR, xlnR, and rhaR. The amyR, alcR, and xlnR screenshots are reproduced from panel A, showing only the ChIP-seq signals for these genes of interest. The upper display threshold set on the genome browser for each screenshot is indicated by the scale bar on the right.
FIG 3
FIG 3
Integrated ChIP-seq and RNA-seq analysis delineates direct and indirect CreA roles on diverse physiological processes beyond carbon metabolism. (A) A schematic diagram illustrating the different regulatory situations for CreA target genes based on the ChIP-seq and RNA-seq results. The genes were grouped into four classes according to the presence or absence of CreA binding at their promoters and the transcriptional effect in the creAΔ mutant compared to the wild type (WT), as shown in the volcano plot at the top. Class 1 genes are subjected to CreA direct repression in the wild type and induced by activators (TF, red triangle) in the creAΔ mutant. Class 2 genes may contain two groups; one group is repressed by CreA in the wild type, but their expression does not increase in the creAΔ mutant due to the absence of transcriptional activator. The other group is activated by activators (red triangle) whose activating function can overwhelm CreA repressive effects, and consequently these genes are expressed at high levels in the wild type and do not have much more induction (e.g., less than 2 folds), if any, in the creAΔ mutant. Class 3 genes are not directly controlled by CreA, but their expression levels are up- or downregulated in the creAΔ mutant due to derepression of transcriptional activator (red triangle) and repressor (blue triangle) genes, respectively, that are controlled by CreA. Class 4 genes are directly bound by CreA, and their high levels of expression in the wild type require CreA. The different classes of genes and their corresponding transcriptional effects in the creAΔ mutant are color-coded similarly in the bottom and top panels, respectively. (B) An overview showing the enriched KEGG pathways in the four classes of genes identified in panel A. The KEGG pathways were broadly classified into six categories, indicated by the different colored dots. The percentage of genes enriched in each KEGG pathway was calculated and is presented in the heatmap. (C) A stacked bar chart displaying the gene expression levels for the genes in class one (blue) and two (red). (D) An UpSet plot showing the overlaps between CreA direct binding and up- and downregulated gene targets.
FIG 4
FIG 4
CreA regulates genes involved in secondary metabolism, iron homeostasis, oxidative stress, and asexual and sexual developmental processes. (A) A bar plot showing percentage of genes from the four regulatory situations (class 1 to 4) identified from the integrated analysis for each secondary metabolism (SM) cluster. (B) A heatmap plot showing gene expression values and changes (in the creAΔ mutant relative to wild type [WT]) for the BenzAldehyde1 (dba) cluster genes. (C) A genome browser screenshot showing CreA ChIP-seq signals at the divergent promoters of dbaF and dbaG. The upper display threshold set on the genome browser for each screenshot is indicated by the scale bar on the right. (D and F) Heatmap plots displaying gene expression changes for pentose phosphate pathway, oxidative phosphorylation, and glutathione (D) and siderophore biosynthesis genes (F) in the creAΔ mutant relative to WT. The presence of CreA binding at their promoters is indicated by a yellow circle. (E and G) Bar plots showing the growth diameter of the wild type and the creAΔ mutants under conditions with the indicated hydrogen peroxide (H2O2) (E) and iron (Fe) concentrations (G). t test was used to determine statistical significance. *, P ≤ 0.05; **, P ≤ 0.01. (H) Heatmap plots showing gene expression values and changes (in the creAΔ mutant relative to the WT) for sexual and asexual developmental genes. The presence of CreA binding at the promoters is indicated by a yellow circle, and transcription factor genes are highlighted in yellow. (I) Photos showing the sexual and asexual phenotypes of the wild type and the creAΔ mutant. (J) Bar graphs present the quantification of cleistothecia and spores of the wild type and the creAΔ mutant shown in panel I. t test was used for the P values. ***, P ≤ 0.001; ****, P ≤ 0.0001.
FIG 5
FIG 5
CreA regulates genes involved in the unfolded protein response, nutrient transport, and filamentous fungal specific functions. (A, B, C, and G) Heatmap plots displaying gene expression changes for transporter genes (A and B), N-glycan and ER-associated genes (C), and ER-associated degradation (ERAD) genes (G) in the creAΔ mutant relative to the wild type (WT) under glucose culture conditions. The presence of CreA binding at their promoters is indicated by a yellow circle. (D) A Venn diagram showing the overlap of CreA-regulated ER-associated genes in A. nidulans and HacA-regulated genes in A. fumigatus and A. oryzae. (E) A genome browser screenshot for CreA ChIP-seq signals at the hacA promoter. The upper display threshold set on the genome browser for each screenshot is indicated by the scale bar on the right. (F) A bar plot showing gene expression values (FPKM) of spliced hacA and nonspliced hacA in the WT and the creAΔ mutant. The level of spliced hacA, which is activated by unfolded protein stress, is presented in gray, while the level of nonspliced hacA is shown in black. Error bars display the FPKM standard deviation between biological repeats. (H) Heatmap plots displaying gene expression changes for N-glycan and ER-associated genes when acetate or proline was used as the sole carbon source.
FIG 6
FIG 6
CreA targets many filamentous fungus-specific genes. (A) A summary diagram displaying orthologue information for A. nidulans genes in the indicated hemi-ascomycete and filamentous ascomycete species. The upper panel shows the presence and absence of orthologue for each A. nidulans gene in the indicated species. The A. nidulans genes were separated into three groups, namely, genes shared by most species (common), genes unique to filamentous ascomycetes (filamentous fungus specific), and genes unique to A. nidulans (A. nidulans specific). The middle panel marks the genes bound by CreA, S. pombe Scr1, or S. cerevisiae Mig1 based on ChIP evidence, while the lower panel indicates differentially expressed genes (as determined by RNA-seq) in the mutant of the creA homologue of the corresponding species. Gene number for each category is indicated by n. (B) Heatmap plot showing the percentage of DEGs enriched in the indicated pathways for the creAΔ mutant of the three different species.
FIG 7
FIG 7
Level of CreA binding to DNA under different carbon conditions is dependent on its protein levels. (A) Heatmap plots showing CreAHA ChIP-seq signals at the promoters of its targets under glucose, acetate, proline, and carbon-free conditions. The background ChIP-seq signal in an untagged wild-type strain grown under glucose conditions was included as a negative control. (B) A boxplot displaying overall CreA ChIP-seq signals for glucose (Glu), acetate (Ace), proline (Pro), and carbon starvation (CS) conditions. Background ChIP-seq signal in an untagged wild-type strain grown under glucose conditions was included as a negative control (NC). t test was used for statistical significance. *, P ≤ 0.05; **, P ≤ 0.01; ***, P ≤ 0.001; ****, P ≤ 0.0001. (C) Western blot analysis showing CreA expression in the wild type grown under glucose, acetate, proline, and carbon starvation conditions. The level of histone H3 was used as an internal loading control. (D) Genome browser screenshots for CreA ChIP-seq signals at the promoter region of alcR and gpdA under glucose, acetate, proline, and carbon starvation conditions. The upper display threshold set on the genome browser for each screenshot is indicated by the scale bar on the right. (E) Western blot analysis showing CreA levels in the wild type [WT(p)creAGFP] and overexpression [gpdA(p)creAGFP] strains grown under glucose conditions. The level of histone H3 was used as an internal loading control. (F) Heatmap plots displaying CreA ChIP-seq signals at the promoter of CreA targets in strains expressing CreAGFP from the native creA [WT(p)creAGFP] or overexpressing gpdA [gpdA(p)creAGFP] promoters under glucose conditions. The background ChIP-seq signal in an untagged wild-type strain grown under glucose conditions was presented as a negative control. (G) A boxplot displaying the overall CreA ChIP-seq signals at the promoter of CreA targets in strains expressing CreAGFP from the native creA [WT(p)creAGFP] or overexpressing gpdA [gpdA(p)creAGFP] promoters under glucose conditions. t test was used for statistical significance. ****, P ≤ 0.0001.
FIG 8
FIG 8
DNA binding competition with pathway specific factors is not a universal mechanism for CreA repression. (A) Genome browser screenshots showing AlcR ChIP-seq signals at the promoter of ethanol metabolism genes under glucose and ethanol conditions. (B) A bar plot showing the number of AlcR binding sites identified by MACS2 under glucose and ethanol conditions. (C) A Venn diagram showing the overlap of CreA and AlcR target genes on ethanol condition. (D) Genome browser screenshots showing AlcR and CreA ChIP-seq signals at select promoter of ethanol metabolism genes on ethanol conditions. The upper display threshold set on the genome browser for each screenshot is indicated by the scale bar on the right. (E) A cumulative plot showing the distributions of distances between AlcR and CreA (red line) and between AcuK and AcuM (black line) ChIP-seq peak summits. The percentages of AlcR-CreA and AcuK-AcuM bound peaks with a distance of less than 50 bp are indicated on the y axis. (F) A bar plot showing the number of promoter binding events with AlcR and CreA summits located within 50 bp of each other (Cobound) or greater than 50 bp apart (Distinct). (G) Genome browser screenshots showing CreA and AlcR ChIP-seq binding signals at the promoter of ethanol metabolism genes under glucose and ethanol conditions. The upper display threshold set on the genome browser for each screenshot is indicated by the scale bar on the right. (H) A scatterplot showing binding level changes of CreA and AlcR between glucose and ethanol conditions at their common target promoters. (I) Bar plots showing the result of ChIP-qPCR against CreA and AlcR at the promoter of ethanol metabolism genes in the same CreAGFP AlcRMyc double-tagged strain grown under repressing (glucose), inducing (ethanol), and induced-repressed (glucose and ethanol) carbon conditions.
FIG 9
FIG 9
CreA exerts its global effects through controlling expression of transcription factor genes but does not compete with their DNA binding. (A) A schematic diagram showing common and unique CreA and AlcR gene targets. The genes for ethanol metabolism are indicated. (B and C) Genome browser screenshots for CreA binding signals on the regulatory (alcR) and structure genes (alcC, alcU, alcA, aldA, alcS, and alcM) for ethanol metabolism (B) and representative transcription factor genes (C). (D) A line plot showing CreA binding levels at the promoter of transcription factor genes with single or multiple binding peaks. (E) A boxplot showing overall CreA ChIP-seq signals on peak summits for TF and non-TF genes. Error bars represent standard deviations of signals. Average signal is indicated by the black line in the box. t test was used for statistical significance. ***, P ≤ 0.001.
FIG 10
FIG 10
Overview of the direct and indirect roles of CreA on carbon metabolism pathways. A summary of CreA binding and transcriptional effect on the genes of various carbon metabolism pathways is shown. The presence or absence of CreA binding at the respective promoter is indicated by solid black and gray boxes, respectively. Up- and downregulated genes in the creAΔ mutant relative to the wild type are colored red and blue, respectively.

Similar articles

Cited by

References

    1. Adnan M, Zheng W, Islam W, Arif M, Abubakar YS, Wang Z, Lu G. 2017. Carbon catabolite repression in filamentous fungi. Int J Mol Sci 19:48. doi:10.3390/ijms19010048. - DOI - PMC - PubMed
    1. Gancedo JM. 1998. Yeast carbon catabolite repression. Microbiol Mol Biol Rev 62:334–361. doi:10.1128/MMBR.62.2.334-361.1998. - DOI - PMC - PubMed
    1. Nehlin JO, Ronne H. 1990. Yeast MIG1 repressor is related to the mammalian early growth response and Wilms' tumour finger proteins. EMBO J 9:2891–2898. doi:10.1002/j.1460-2075.1990.tb07479.x. - DOI - PMC - PubMed
    1. Lutfiyya LL, Iyer VR, DeRisi J, DeVit MJ, Brown PO, Johnston M. 1998. Characterization of three related glucose repressors and genes they regulate in Saccharomyces cerevisiae. Genetics 150:1377–1391. doi:10.1093/genetics/150.4.1377. - DOI - PMC - PubMed
    1. Lutfiyya LL, Johnston M. 1996. Two zinc-finger-containing repressors are responsible for glucose repression of SUC2 expression. Mol Cell Biol 16:4790–4797. doi:10.1128/MCB.16.9.4790. - DOI - PMC - PubMed

MeSH terms

LinkOut - more resources