. 2021 Feb 22;13(1):e0371821.
doi: 10.1128/mbio.03718-21. Epub 2022 Feb 15.

Inhibition of Protein N- Glycosylation Blocks SARS-CoV-2 Infection

Affiliations

Inhibition of Protein N- Glycosylation Blocks SARS-CoV-2 Infection

Aitor Casas-Sanchez et al. mBio. .

Abstract

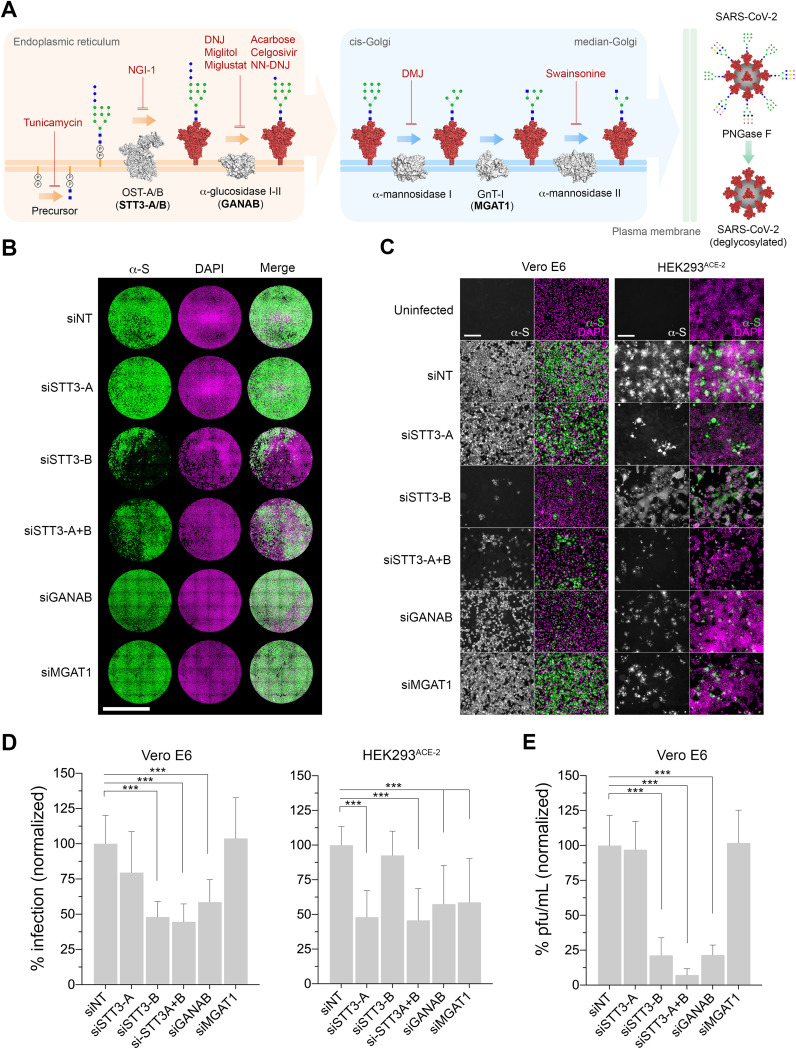
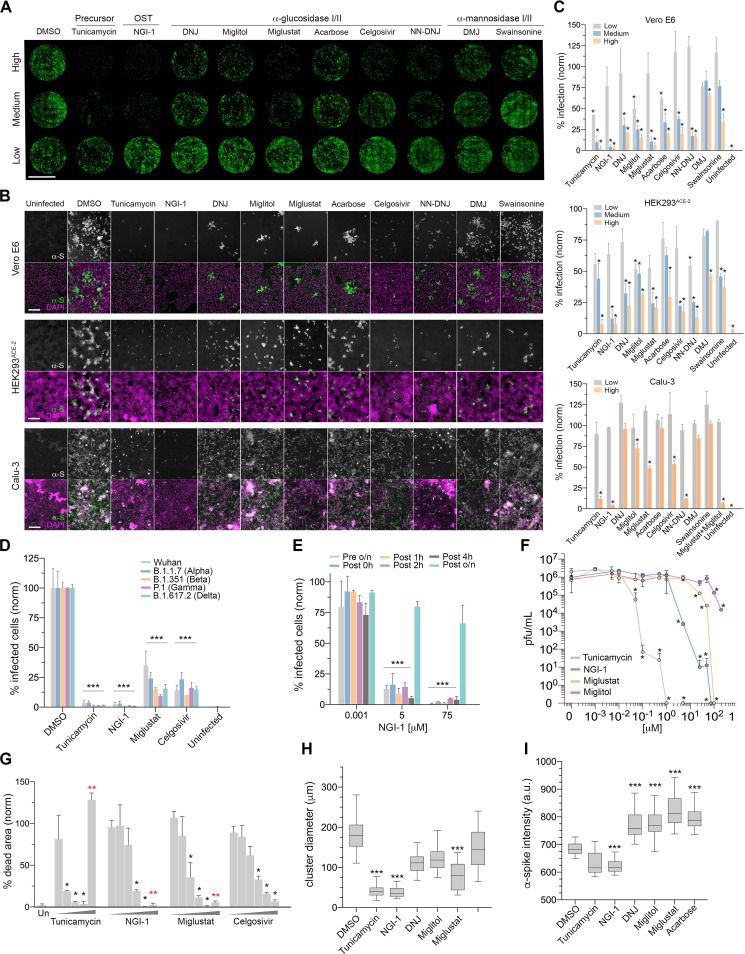
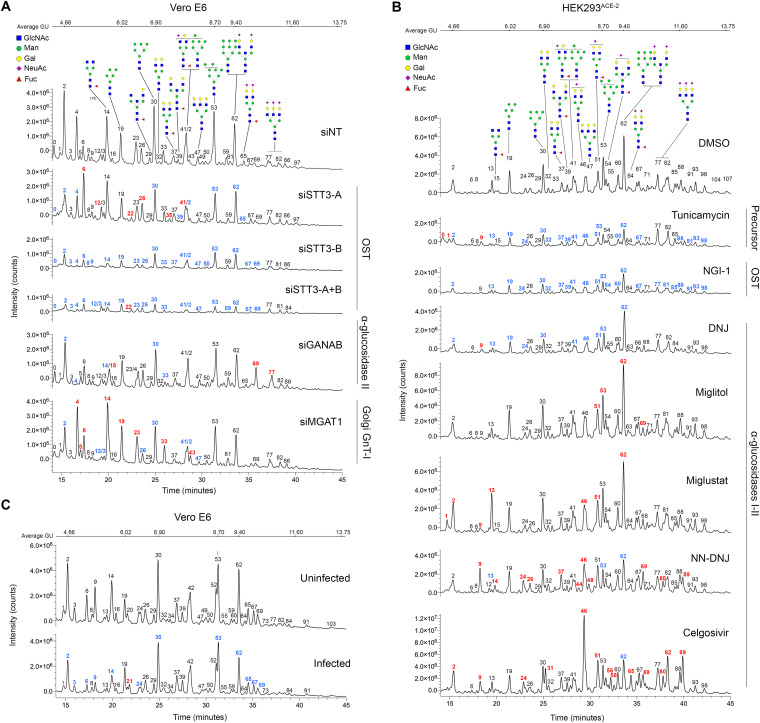
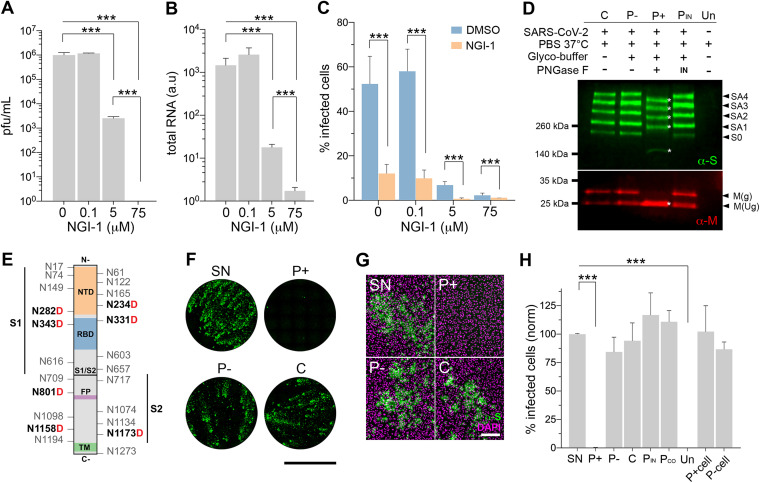
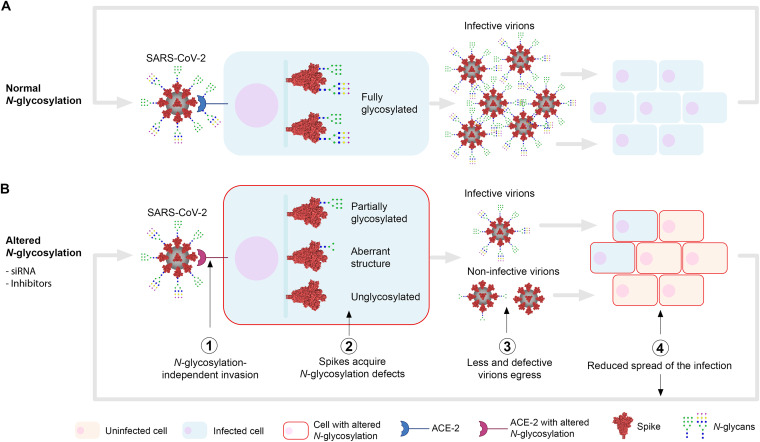
Severe acute respiratory syndrome coronavirus-2 (SARS-CoV-2) extensively N-glycosylates its spike proteins, which are necessary for host cell invasion and the target of both vaccines and immunotherapies. These N-glycans are predicted to modulate spike binding to the host receptor by stabilizing its open conformation and host immunity evasion. Here, we investigated the essentiality of both the host N-glycosylation pathway and SARS-CoV-2 N-glycans for infection. Ablation of host N-glycosylation using RNA interference or inhibitors, including FDA-approved drugs, reduced the spread of the infection, including that of variants B.1.1.7 (Alpha), B.1.351 (Beta), P.1 (Gamma) and B.1.617.2 (Delta). Under these conditions, cells produced fewer virions and some completely lost their infectivity. Furthermore, partial enzymatic deglycosylation of intact virions showed that surface-exposed N-glycans are critical for cell invasion. Altogether, we propose protein N-glycosylation as a targetable pathway with clinical potential for treatment of COVID-19. IMPORTANCE The coronavirus SARS-CoV-2 uses its spike surface proteins to infect human cells. Spike proteins are heavily modified with several N-glycans, which are predicted to modulate their function. In this work, we show that interfering with either the synthesis or attachment of spike N-glycans significantly reduces the spread of SARS-CoV-2 infection in vitro, including that of several variants. As new SARS-CoV-2 variants, with various degrees of resistance against current vaccines, are likely to continue appearing, halting virus glycosylation using repurposed human drugs could result in a complementary strategy to reducing the spread of COVID-19 worldwide.

Keywords: COVID-19; N-glycosylation; SARS-CoV-2; antiviral agents; coronavirus; glycosylation; viral infection.


Conflict of interest statement

The authors declare no conflict of interest.

Figures

FIG 1
FIG 1
Genetic ablation of host N-glycosylation reduces SARS-CoV-2 infection. (A) Schematic of the key steps in the N-glycosylation pathway targeted in this study. The precursor N-glycan is first synthesized in the ER and transferred to the SARS-CoV-2 spike protein (red) by the OST’s catalytic subunit, STT3 (isoforms A and B). The N-glycans are further processed by the α-glucosidases I and II (GANAB catalytic subunit) before the glycoprotein is exported to the Golgi apparatus, where the glycans are modified by the α-mannosidase I, GnT-I (MGAT1), and α-mannosidase II. Mature glycosylated virions egress to the extracellular space, where they can be artificially deglycosylated using PNGase F. Glycosylation enzymes, gray; glycosylation inhibitors, red text; glycosylation enzymes targeted by siRNA, boldface text. N-glycans are represented using CFG nomenclature. Blue square, N-acetylglucosamine; green circle, mannose; blue circle, glucose; yellow circle, galactose; magenta diamond, sialic acid; virion N-glycan structures are representative only. (B) Representative whole-well scans of confluent Vero E6 monolayers transfected either with siNT (nontargeting control) or siRNAs targeting STT3-A, STT3-B, STT3A+B, GANAB, and MGAT1 and infected with SARS-CoV-2 (MOI of 0.05, 24 h). Cells immunostained using anti-spike antibodies (green), counterstained with DAPI DNA staining (magenta), and merged. Scale bar, 5 mm. (C) Representative images of Vero E6 and HEK293ACE-2 siRNA cells infected with SARS-CoV-2 (MOI of 0.05 for 24 h, Vero; MOI of 0.1 for 24 h, HEK293). Anti-spike, gray; merge, green; with DAPI, magenta. Scale bars, 200 μm. (D) Percentage of Vero E6 and HEK293ACE-2 infected cells (anti-spike positive) in panel A, normalized to siNT. Three technical replicates and four and three biological replicates were done for Vero and HEK cells, respectively. (E) Infectious viral particles (PFU/mL) in supernatants from infected Vero E6 siRNA cells in panel A, normalized to siNT. Bars indicate mean values, error bars represent ± standard deviations (SD), and asterisks indicate significance (P < 0.001).
FIG 2
FIG 2
Glycosylation inhibitors reduce the spread of SARS-CoV-2 infection. (A) Representative whole-well scans of confluent Vero E6 monolayers treated with either high, medium, or low dose of inhibitors and infected with SARS-CoV-2 (MOI of 0.05, 24 h). Cells were immunostained using anti-spike antibodies (green). Scale bar, 5 mm. (B) Representative images of Vero E6 in panel A treated with high-dose inhibitors, HEK293ACE-2 cells (MOI of 0.1, 24 h), and Calu-3 cells (MOI of 0.1, 24 h). Anti-spike, gray; merge, green; with DAPI, magenta. Scale bars, 200 μm. (C) Percentage of infected (anti-spike positive) cells in panels A and B, normalized to DMSO controls. Two technical replicates and two biological replicates were done. Asterisks indicate significance (P < 0.05). Inhibitor concentrations (low, medium, ands high, in μM) were the following: tunicamycin (0.001, 0.01, 0.05); NGI-1 (0.001, 5, 75); DNJ (0.01, 60, 120); miglitol (0.01, 50, 200); acarbose (0.01, 100, 300); miglustat (0.01, 50, 100); celgosivir, swainsonine, NN-DNJ, and DMJ (0.01, 25, 100). (D) Percentage of infected Vero E6 cells pretreated with high-dose inhibitors and infected with either the Wuhan (Liverpool) isolate or variants B.1.1.7, B.1.351, P.1, and B.1.617.2, normalized to DMSO controls (MOI of 0.05, 24 h). (E) Percentage of infected Vero E6 cells (MOI of 0.05, 24 h) treated with inhibitors at different time points in relation to inoculation (preincubation overnight [o/n]; 0 h coincubation; and 1, 2, 4 h and overnight postincubation) with 0.001, 5, or 75 μM NGI-1, normalized to DMSO controls. (F) Viral titers in Vero E6 supernatants treated with inhibitors and infected with SARS-CoV-2 (MOI of 0.001, 48 h); dots indicate mean values from two technical replicates and two biological replicates. (G) Area percentage covered by dead Vero E6 cells treated with inhibitors (low to high dose) and infected with SARS-CoV-2 (MOI of 0.001, 48 h), normalized to DMSO controls. Two technical replicates and two biological replicates were done; two red asterisks indicate death by toxicity. (H) Box plot of cluster diameter (μm) of infected Vero E6 cells in panels A and B treated with high-dose inhibitors; horizontal lines represent mean values, and whiskers represent ± confidence intervals. (I) Fluorescence intensity of anti-spike antibodies in infected Vero E6 cells in panels A and B treated with high-dose inhibitors. Bars indicate mean values; error bars represent ± SD; and asterisks indicate significance (P < 0.05).
FIG 3
FIG 3
N-Glycoprofiling confirms glycosylation changes in siRNA- and drug-treated cells. (A) HILIC-UPLC chromatograms plotting fluorescence intensity total counts over time of released N-glycans from Vero E6 cells treated with siNT (control), siSTT3-A, siSTT3-B, siSTT3-A+B, siGANAB, and siMGAT1. (B) Chromatograms of N-glycans from HEK293ACE-2 cells treated with glycosylation inhibitors (tunicamycin, 0.1 μM; NGI-1, 5 μM; DNJ, 100 μM; Miglitol, 100 μM; miglustat, 100 μM; NN-DNJ, 100 μM; and celgosivir, 100 μM) or DMSO. (C) Chromatograms of N-glycans from Vero E6 cells either infected with SARS-CoV-2 or noninfected. Glycan are structures in CFG nomenclature; structures are assumed from chromatographic mobility of standards and not confirmed by mass spectrometry. Peaks are identified with numbers; colors represent intensity decrease (blue) or increase (red) compared to the corresponding control sample. The procainamide molecule linked to each glycan is omitted.
FIG 4
FIG 4
SARS-CoV-2 surface N-glycans are essential for infection. (A) Infective particles in infected Vero E6 supernatants (MOI of 0.001, 48 h) treated with 0, 0.1, 5, and 75 μM NGI-1. (B) Total SARS-CoV-2 RNA in supernatants in panel A. (C) Proportion of infected Vero E6 cells treated with 0, 0.1, 5, and 75 μM NGI-1 and infected with virus from either untreated (DMSO) or 5 μM NGI-1-treated cell supernatants (MOI of 0.05, 24 h); inoculum normalized by total viral RNA. (D) Western blot using anti-spike (green) and anti-M (red) antibodies on lysed native purified virions (C) of mock treated (P-), PNGase F-treated (P+), and heat-inactivated PNGase F-treated (PIN) cells or supernatant from uninfected cells (Un). Treatment legend (top), apparent molecular mass (left), and band identity (right) are given. Full-length spike (S0), spike aggregates (SA), and glycosylated (g) and unglycosylated (Ug) M protein are shown; asterisks highlight downshifted bands. (E) Spike protein schematic highlighting all N-glycosylation sites and asparagines (N) converted to aspartic acid (boldface red D) after PNGase F deglycosylation as found by mass spectrometry and spike subunits (S1, S2), N-terminal domain (NTD), receptor binding domain (RBD), fusion peptide (FP), ands transmembrane domain (TM). (F) Whole-well scans of confluent Vero E6 cells infected with SARS-CoV-2 supernatant (SN) or purified virions analyzed in panels D (MOI of 0.05, 24 h). Anti-spike antibodies, green; scale bar, 5 mm. (G) Representative images of Vero E6 cells in panel F. Anti-spike, green; merged with DAPI counterstain, magenta. Scale bar, 200 μm. (H) Percentage of infected cells in panel F, including purified virions coinoculated with active PNGase F (PCO) and cells either pretreated (P+cell) or not treated (P-cell) with active PNGase F prior to inoculation with native virions, normalized to SN. Bars indicate mean values, error bars show +SD, and asterisks indicate significance (P < 0.001).
FIG 5
FIG 5
Schematic of the role of N-glycosylation in SARS-CoV-2 infection. Initially, SARS-CoV-2 virions can invade the host cell regardless of its N-glycosylation status (i.e., inhibited N-glycosylation, deglycosylated ACE-2) (1). Once it starts replicating, unlike in control cells (A), where spike proteins are normally N-glycosylated (66 sites per trimer), cells with inhibited N-glycosylation (B) (e.g., treated with glycosylation inhibitors or glycosylation genes downregulated using siRNAs) will produce spikes presenting partial glycosylation (<66 glycosylated sites), aberrant glycan structures, and/or no glycosylation at all (2). Improperly glycosylated spikes may misfold, accumulate in the ER, and/or degrade, leading to egression of fewer and defective virions (3). These virions become less infective or noninfective to neighboring cells as they lack spike N-glycan structures essential for invasion (4). Replication in these cells with inhibited N-glycosylation again will generate less and noninfective virions (2 to 4), therefore exponentially amplifying the reduction of the spread of the infection. N-glycan structures (CFG nomenclature) are representative only; the blue intracellular vertical bar represents the secretory pathway.

Similar articles

Cited by

References

    1. Lu R, Zhao X, Li J, Niu P, Yang B, Wu H, Wang W, Song H, Huang B, Zhu N, Bi Y, Ma X, Zhan F, Wang L, Hu T, Zhou H, Hu Z, Zhou W, Zhao L, Chen J, Meng Y, Wang J, Lin Y, Yuan J, Xie Z, Ma J, Liu WJ, Wang D, Xu W, Holmes EC, Gao GF, Wu G, Chen W, Shi W, Tan W. 2020. Genomic characterisation and epidemiology of 2019 novel coronavirus: implications for virus origins and receptor binding. Lancet 395:565–574. doi:10.1016/S0140-6736(20)30251-8. - DOI - PMC - PubMed
    1. Hoffmann M, Kleine-Weber H, Schroeder S, Krüger N, Herrler T, Erichsen S, Schiergens TS, Herrler G, Wu N-H, Nitsche A, Müller MA, Drosten C, Pöhlmann S. 2020. SARS-CoV-2 cell entry depends on ACE2 and TMPRSS2 and is blocked by a clinically proven protease inhibitor. Cell 181:271–280. doi:10.1016/j.cell.2020.02.052. - DOI - PMC - PubMed
    1. Walls AC, Park Y-J, Tortorici MA, Wall A, McGuire AT, Veesler D. 2020. Structure, function, and antigenicity of the SARS-CoV-2 spike glycoprotein. Cell 181:281–292.e6. doi:10.1016/j.cell.2020.02.058. - DOI - PMC - PubMed
    1. Shajahan A, Archer-Hartmann S, Supekar NT, Gleinich AS, Heiss C, Azadi P. 2021. Comprehensive characterization of N- and O-glycosylation of SARS-CoV-2 human receptor angiotensin converting enzyme 2. Glycobiology 31:410–424. doi:10.1093/glycob/cwaa101. - DOI - PMC - PubMed
    1. Casalino L, Gaieb Z, Goldsmith JA, Hjorth CK, Dommer AC, Harbison AM, Fogarty CA, Barros EP, Taylor BC, McLellan JS, Fadda E, Amaro RE. 2020. Beyond shielding: the roles of glycans in the SARS-CoV-2 spike protein. ACS Cent Sci 6:1722–1734. doi:10.1021/acscentsci.0c01056. - DOI - PMC - PubMed

Substances

Supplementary concepts